- Home
- Weather
- Ryan Maue Weather City
- Data Status
- Forecast Eagle
- Temp vs Normal
- Trillions of Gallons
- Coldest Since...
- Hottest Since...
- Precipitation Earth
- Snowfall Earth
- Forecast Flakes
- ENSO and Snowfall Earth
- Football Weather
- Dollar General Weather
- Tropical Summary
- Global Tropical Summary
- Squall Cloud
- Degree Days
- Advisory Map
- Advisory Table
- Areal Impacts
- Climate Divisions
- Climate Events
- Today
- Watches/Warnings Map
- Sunrise/Sunset Almanac
- Live Big Canoe Weather
- Big Canoe Hourly Weather
- Big Canoe NDFD Weekly Forecast
- NWS NDFD Point Forecast
- NWS Fire Weather Point Forecast
- Daily World Weather Extremes
- NWS GIS Viewer
- NWS NDFD Graphical Forecast
- NWS Forecast Products
- Current Georgia Conditions
- Current Big Canoe Conditions
- Big Canoe 2 Hour Trends
- GOES 19 Satellite Loops
- CoCoRaHS Precip Map
- NWS - Forecasts by States
- NWS - Forecast Products
- Great Smoky Mtns NP Forecast
- NWS Text Products
- NWS Hazards Viewer
- NWS Forecast by State
- NWS Forecast Offices
- NWS Rainfall Forecast
- FFC Snow Accumulation Graphics
- FFC Snow Probability Graphics
- FFC Ice Accumulation Graphics
- FFC Ice Probability Graphics
- FFC North Geaorgia Graphics
- FFC Georgia Wind Chill
- WPC Winter Storm Severity Index
- NWS - Decoded METAR Obs
- NWS - NDFD Meteograms
- NWS - Weather Prediction Center
- Short Range Discussion
- Extended Range Discussion
- Excessive Rain Discussion
- Probabilistic Snow Discussion
- QPF Outlook
- QPF Loop
- 500MB Height Trends
- Sea Level Trends
- Max Temp Day 3-7
- Min Temp Day 3-7
- Winter Storm Severity Index
- Graphical Snow Analysis
- Freezing Analysis
- Probabilistic Winter Precip
- Storm Summary
- NWS - Storm Prediction Center
- SPC Situational Awareness Page
- Severe Weather Outlook Changes
- Severe Weather Outlook - Day 1
- Severe Weather Outlook - Day 2
- Severe Weather Outlook - Day 3
- Severe Weather Outlook - Day 4
- Graphical Severe Weather Outlook
- NEW SPC Severe Watches
- NEW Mesoscale Discussion
- NEW SPC Storm Reports
- Meso-Analysis Maps
- Soundings Climatology
- SREF Model
- CompMap
- NWS - Upper Air Soundings
- Fire Weather
- Big Canoe CoCoRaHS Data
- Hydrology
- Drought Monitor
- NWS - Flash Flood Guidance
- WPC - QPF Forecast Discussion
- WPC - Excessive Rain Discussion
- US Soil Conditions
- SERFC River Status
- Lake Lanier Data
- NWS River Obs and Forecast
- Ensemble Forecast
- River/Lake/Stream Report
- Water Watch
- Selected Metro River Gauges
- 48 Hr Southeast Rainfall
- Southeast Watershed
- US Watershed
- Snow, Ice, & Freeze Data
- EMWIN Message Archive
- Ryan Maue Weather City
- Climate
- Climate Events
- Coldest Since...
- Hottest Since...
- Precipitation Earth
- Celsius Earth Earth
- CPC Graphical and Text Outlooks
- ----- Georgia Climate Pages -----
- Georgia Climate
- North Georgia Climate Summary
- GA Winter Weather Climatology
- GA Severe Weather Climatology
- GA Climate Sites Climatology
- Atlanta Temperature Climatology
- Big Canoe Precip Climatology
- Big Canoe NOAA Climate Reports
- -------------------------------
- 2026 - North GA Temp Study
- 2025 - North GA Temp Study
- Seasonal Temp Summary - Summit
- Yearly Temp Summary - Summit Dr
- Yearly Temp Summary - Sanderlin
- Yearly Temp Summary - Atlanta
- Yearly Precip Summary - Summit
- Yearly Freeze Summary
- Degree Days - Summit Dr
- Degree Days - Sanderlin
- Degree Days - Atlanta
- Georgia Winter Weather Climate
- GA Winter Weather Climatology
- Notable Georgia Winter Seasons
- Winter of 1950-1951
- Winter of 1962-1963
- Winter of 1976-1977
- Winter of 1977-1978
- Winter of 1978-1979
- Winter of 1981-1982
- Winter of 1984-1985
- Winter of 1989-1990
- Winter of 2000-2001
- Winter of 2002-2003
- Winter of 2009-2010
- Winter of 2009-2010 Main
- Winter of 2010-2011
- Winter of 2013-2014
- Winter of 2014-2015
- Coldest Georgia Winters
- 1950-2025 - Below Normal Winters
- 2000-2025 - Coldest Winters
- Top Georgia Snow/Ice Storms
- Top 21 Atlanta Snows
- Big Canoe Freeze Data
- Georgia Christmas Climo
- Snow Ratios Explained
- 1990-Present DJF Temp Anom
- 2000-Present DJF Temp Anom
- Georgia Winter Storm History
- Georgia Severe Weather Climate
- 2026 Tornado Summary FFC
- GA Severe Weather Climatology
- SPC Severe Climatology (New!)
- SPC Severe Climatology (Old)
- Soundings Climatology
- Tornado Summary
- Tornado Data by State
- Tornado Facts - 2011
- Tornado Stats Slideshow
- Tornado Maps - US Annual
- Tornado Graphs for Georgia
- Daily and Total Storm Reports
- Watch Frequency Maps
- 30 Year Severe Weather Climo
- Meso-Archive Maps
- Georgia Severe Storm History
- -------------------------------
- 2025 - Temperature Anomalies
- Global and US Surface Temps
- 50 State Climate Summary
- 2009 - Climate Summary
- 2010 - Climate Summary
- 2011 - Climate Summary
- 2024 - Climate Summary
- Daily Maps (2003-2026)
- Daily Maps (1871-2002)
- Radar
- Satellite
- Maps
- Tropical
- Tropical Summary
- Global Tropical Summary
- Tomer Burg Tropical
- NHC Public Advisory
- Tropical Verification
- NHC Tropical Products
- Atlantic Weather
- Water Temps and Vapor
- Ocean Forecasts
- TC Formation Charts
- Hurricane Info
- Coastal Weather
- External Tropical Sites
- TropicalAtlantic.com
- Marine Forecast
- National Hurricane Center
- NOAAWatch.gov
- NCEP Model Run Status
- Teleconnections Charts and Data
- ENSO Charts and Data
- MJO Charts and Data
- Stratosphere Charts and Data
- Atmospheric River
- SREF Model
- Deterministic Model Verification
- Ensemble Model Verification
- Subseasonal Verification
- CAM Model Verification
- Meso Model Verification
- ---------- Model Sites ----------
- Weather.us
- PSU eWall
- PivotalWeather.com
- TropicalTidbits.com
- TwisterData.com
- WeatherModels.com
- WeatherBell.com
- NWS - National Weather Service
- CPC - Climate Prediction Center
- WPC - Weather Prediction Center
- SPC - Storm Prediction Center
- NHC - National Hurricane Center
- NESDIS (Satellite}
- NCDC - National Climate Data Cntr
- PSL - Physical Sciences Lab
- NWS - Regional Headquarters
- NWS - Southeast Offices
- NWS - Aviation Weather Offices
- NWS - River Forecast Centers
- NWS - Water
- NOAA Weather Radio
- NEXRAD Radar Status
- NEXRAD Radar Operations Center
- NWS Guidebook
- Air Quality
- Satellite
- Climate
- Daily World Weather Extremes
- Football Weather
- Mauna Loa C02 Readings
- World Magnetic Model
- Southeast Seismic Zones
- Real-Time Earthquake
- Bird Migration Loop
- Southeast Growing Info
- Atlanta Pollen Count
- Air Quality Index
- UV Forecast
- Mt Washington NH Weather
- Space Weather
- Space Warning Levels
- SDO Images and Videos
- Alps Webcams
- Berry Eagles Webcam
- Tides and Currents
- SouthernClimate.org
- SCCA Solo Nationals Weather
- Dollar General Weather
- Cadillac ATS-V Production #
- ATS-V Color Descriptions
Global Stratospheric Temperature Time Series
Data From CPC


The CPC global temperature analyses are derived each day at 8 stratospheric levels, 100, 70. 50, 30, 10, 5, and 2 hPa (approximately 18-55 km). Graphical aids for monitoring temperature anomalies in the stratosphere are shown here for 70 hPa and 50 hPa (approx. 20 km), representative of the lower stratosphere, 30 hPa and 10 hPa (approx. 30 km) representing the middle stratosphere, and 5 hPa, 2 hPa (approx. 42 km), and 2 hPa representing the upper stratosphere. Daily temperature values averaged over each latitude region (90-60N,65-25N, 25N-25S, 25-65S, 65-90S) are shown. The values for the current year (bold red line) may be compared to the average values for each day (green) and the extreme maximum and minimum values for the entire temperature analysis record from 1979 to current, (bounding upper and lower black lines).
|
Click here for archived data | Data is at least 1 day behind the current date and usually updates between 9am-12pm EST Time Series GFS Analyses and 16 Day Forecasts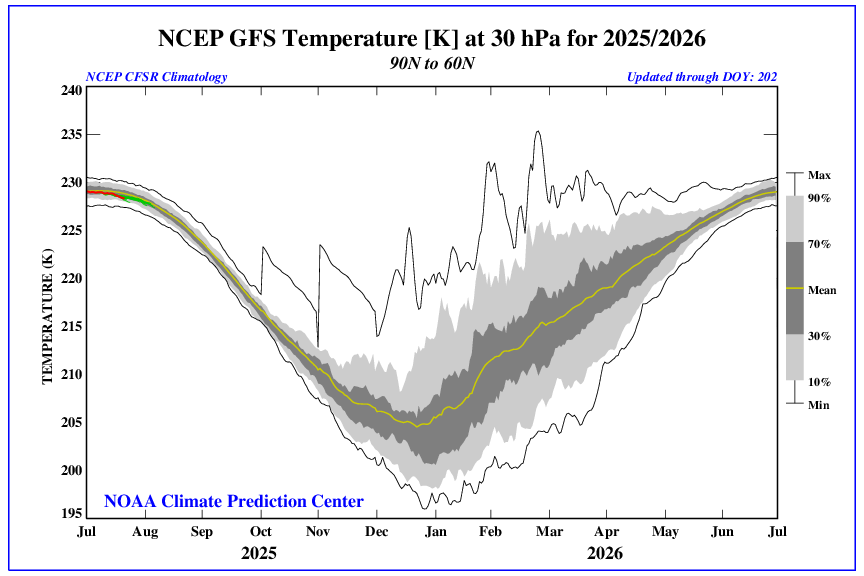
Images open in a pop-up window |
| Temperatures | 100 mb | 70 mb | 50 mb | 30 mb | 10 mb | 5 mb | 2 mb |
|---|---|---|---|---|---|---|---|
| Wind | 100 mb | 70 mb | 50 mb | 30 mb | 10 mb | 5 mb | 2 mb |
| Heat Flux | 100 mb | 70 mb | 50 mb | 30 mb | 10 mb | 5 mb | 2 mb |
Time Series GEFS Analyses and 16 Day Forecasts
| Temperature | 100 mb | 50 mb | 10 mb |
|---|---|---|---|
| Wind | 100 mb | 50 mb | 10 mb |
| Heat Flux | 100 mb | 50 mb | 10 mb |
Never base important decisions on this or any weather information obtained from the Internet.
Always have a backup method of receiving weather information such as a battery powered weather radio.
Copyright © 2026 DaculaWeather.com
