Pacific North American Index (PNA)
Data Courtesy NWS Climate Prediction Center


AO Index | AMOC Index | ENSO | EPO Index | MEIv2 Index | NAO Index | PDO Index | PNA Index | QBO Index | Teleconnection Monthly Summary
1950's | 1960's | 1970's | 1980's | 1990's | 2000's | 2010's | 2020's
ENSO and Snowfall Earth | 1960's | 1970's | 1980's | 1990's | 2000's | 2010's | 2020's
Pacific-North American Index (PNA)
The Pacific-North American teleconnection pattern (PNA) is a climatological term for a large-scale weather pattern with two modes, denoted positive and negative, and which relates the atmospheric circulation pattern over the North Pacific Ocean with the one over the North American continent. The PNA is one of the most recognized, influential climate patterns in the Northern Hemisphere mid-latitudes beyond the tropics. It consists of anomalies in the geopotential height fields (typically at 700 or 500mb) observed over the western and eastern United States. It is important to note that the PNA has been found to be strongly influenced by the El Nino-Southern Oscillation (ENSO) phenomenon. The positive phase of the PNA pattern tends to be associated with Pacific warm episodes (El Nino), and the negative phase tends to be associated with Pacific cold episodes (La Nina).

The positive phase of the PNA pattern features above-average barometric pressure heights in the vicinity of Hawaii and over the inter-mountain region of North America, and below-average heights located south of the Aleutian Islands and over the southeastern United States. The PNA pattern is associated with strong fluctuations in the strength and location of the East Asian jet stream. The positive phase is associated with an enhanced East Asian jet stream and with an eastward shift in the jet exit region toward the western United States. The negative phase is associated with a westward retraction of that jet stream toward eastern Asia, blocking activity over the high latitudes of the North pacific, and a strong split-flow configuration over the central North Pacific.
The positive phase of the PNA pattern is associated with above-average temperatures over western Canada and the extreme western United States, and below-average temperatures across the south-central and southeastern US. The PNA tends to have little impact on surface temperature variability over North America during summer. The associated precipitation anomalies include above-average totals in the Gulf of Alaska extending into the Pacific Northwestern United States, and below-average totals over the upper Midwestern United States. The negative PNA phase is associated with the opposite.
Although the PNA pattern is a natural internal mode of climate variability, it is also strongly influenced by the El Nino-Southern Oscillation (ENSO) phenomenon. The positive phase of the PNA pattern tends to be associated with Pacific warm episodes (El Nino), and the negative phase tends to be associated with Pacific cold episodes (La Nina).
PNA Tri-Pole Patterns

3 Month Running Mean

January, February, March Climatology

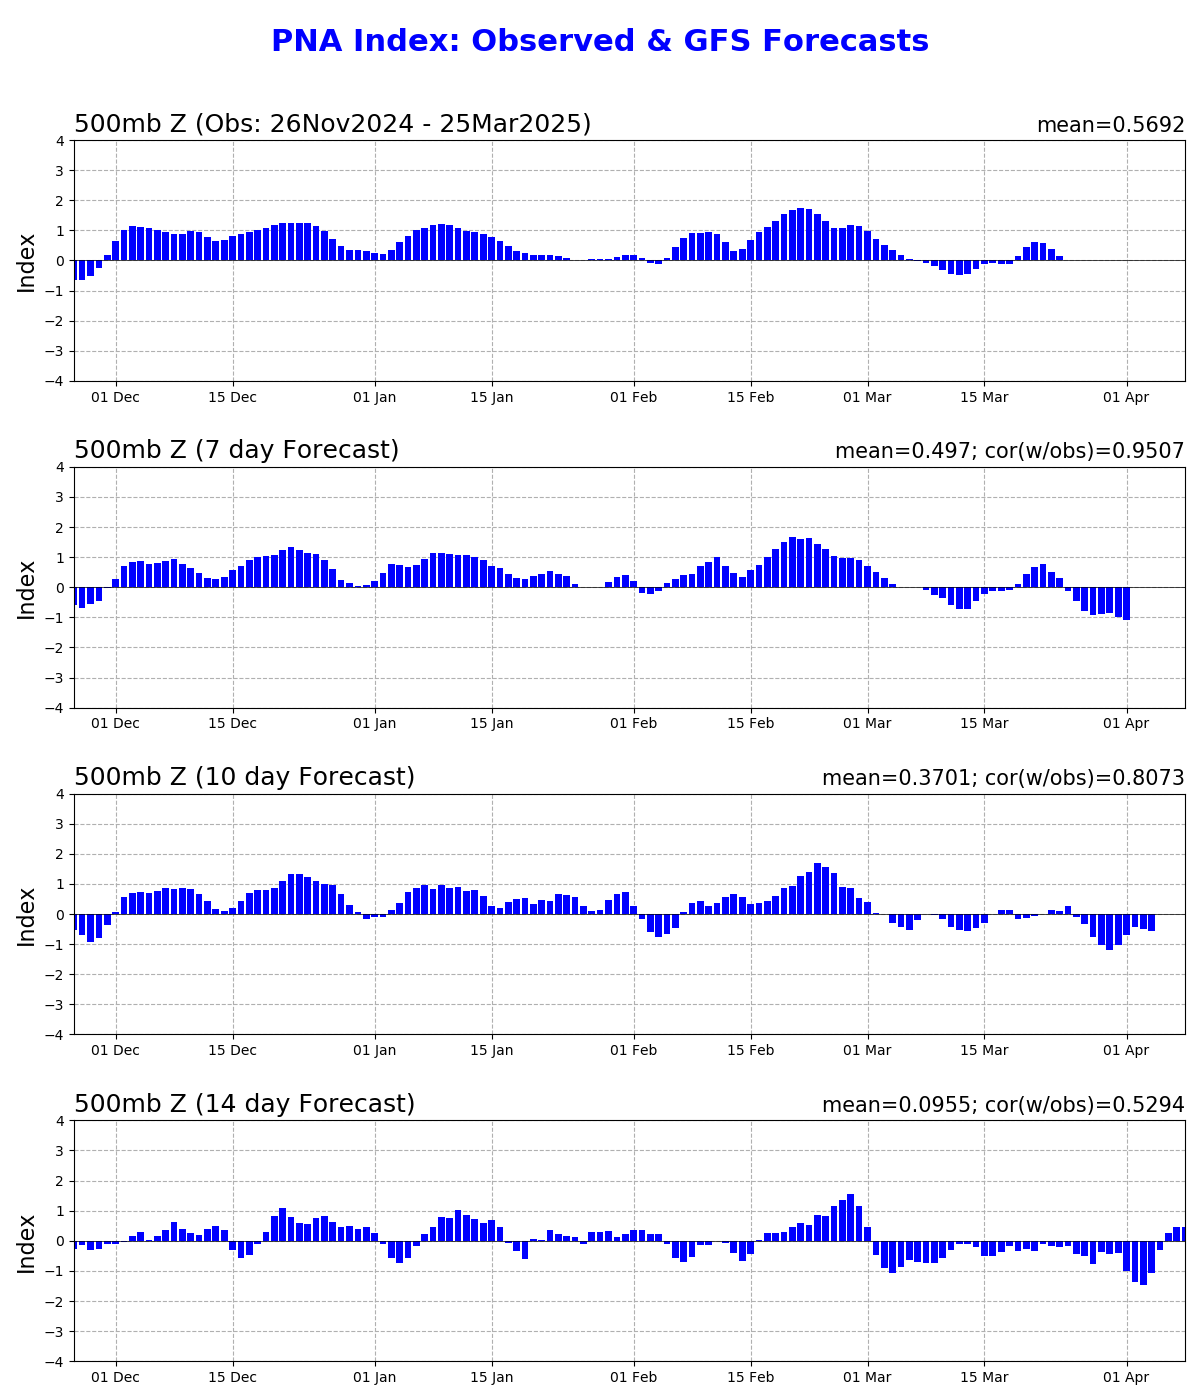
GFS PNA Observed and Forecast
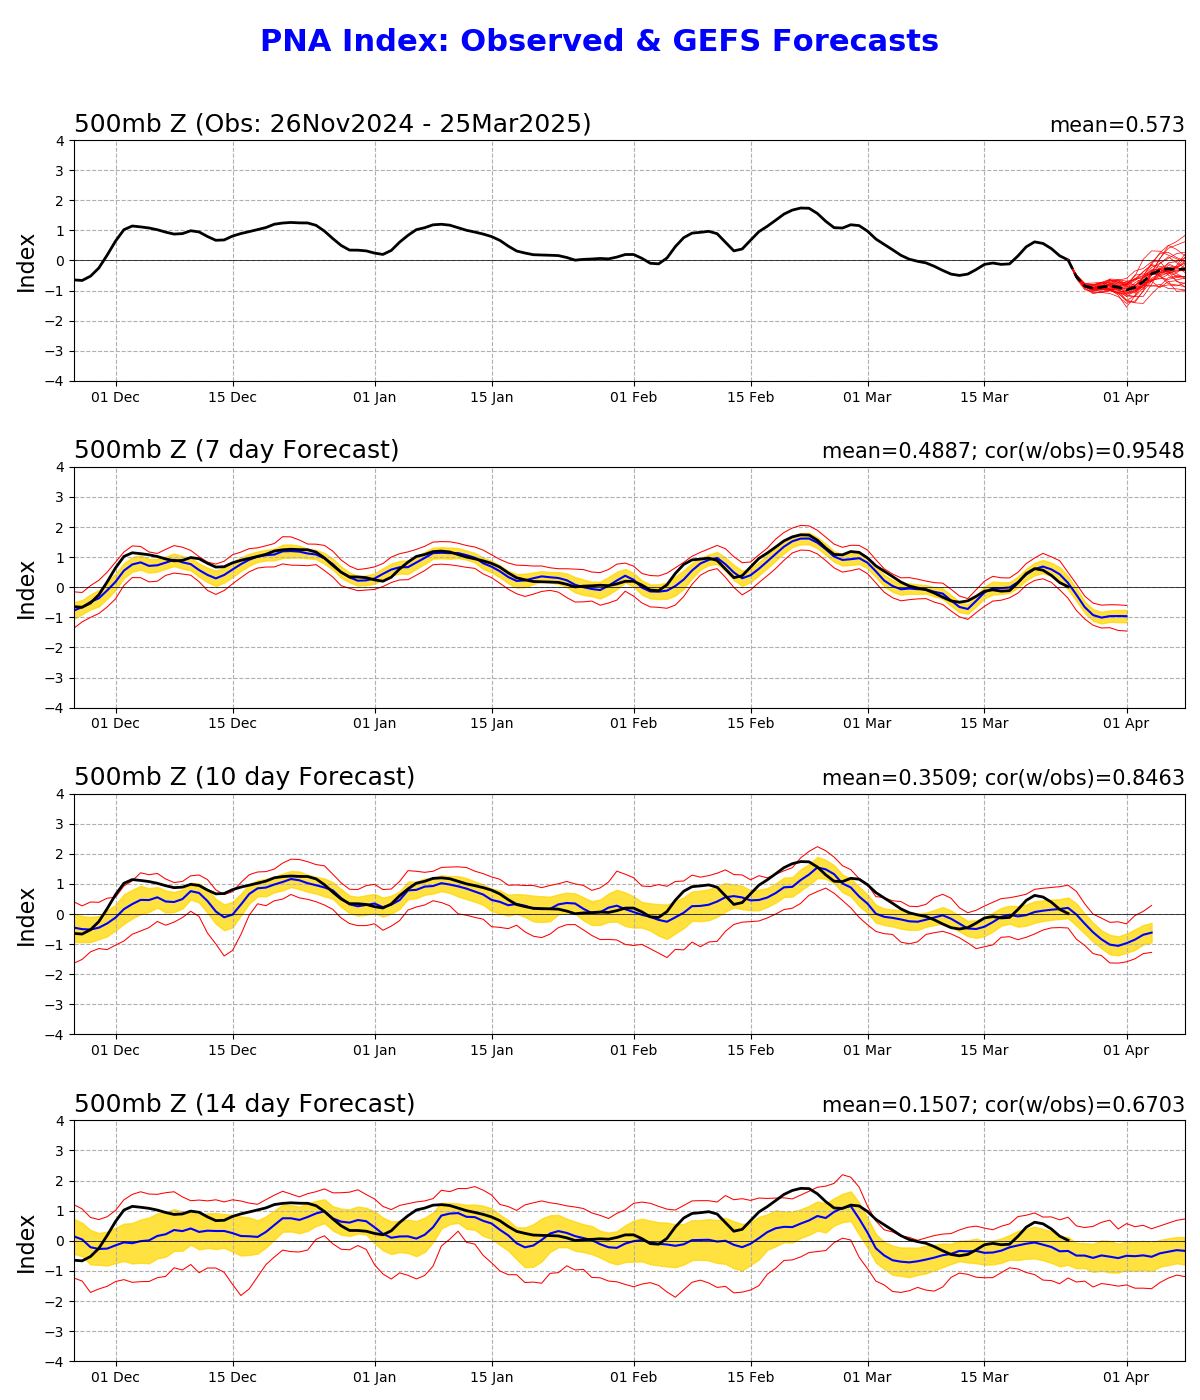
GEFS PNA Observed and Forecast
PNA Values by Month and Year
| Pacific-North American Index (PNA) | |||||||||||||
| Year | Jan | Feb | Mar | Apr | May | Jun | Jul | Aug | Sep | Oct | Nov | Dec | Avg |
| 1950 | -2.34 | -1.04 | 0.24 | 0.01 | -0.55 | -1.97 | -0.43 | 0.82 | -1.15 | 0.49 | -1.81 | 0.02 | -0.64 |
| 1951 | -0.41 | -1.36 | -0.81 | 0.73 | 1.26 | -0.61 | -0.02 | 0.05 | -0.05 | 0.24 | 0.23 | -1.29 | -0.17 |
| 1952 | -1.98 | 0.28 | -0.40 | 1.16 | -0.99 | 0.39 | -1.23 | 0.80 | 0.53 | 0.80 | 0.82 | 0.93 | 0.09 |
| 1953 | 0.65 | 1.00 | -0.15 | 1.05 | 1.20 | -1.60 | 0.74 | -1.12 | -0.12 | 1.91 | 1.65 | 1.27 | 0.54 |
| 1954 | -1.14 | -0.14 | -1.17 | -2.70 | 0.64 | -0.02 | 0.30 | -0.08 | 0.00 | 0.75 | 1.45 | -0.52 | -0.22 |
| 1955 | 0.40 | -1.74 | -2.23 | 0.00 | -0.57 | 0.00 | -0.96 | -0.52 | -0.21 | 0.31 | -0.96 | -2.07 | -0.71 |
| 1956 | -1.32 | -1.04 | -0.69 | 0.07 | -0.29 | -0.18 | -0.92 | -0.20 | 0.55 | -2.11 | 1.06 | -0.31 | -0.45 |
| 1957 | -1.19 | -1.19 | 1.10 | -0.17 | 1.31 | 0.12 | 0.33 | -0.96 | -0.22 | 0.27 | 0.52 | -0.43 | -0.04 |
| 1958 | 0.99 | 0.49 | 0.49 | 0.57 | 0.65 | 1.29 | 1.24 | 2.15 | -0.01 | 0.16 | 0.09 | 0.65 | 0.73 |
| 1959 | -0.69 | -0.70 | 0.52 | -0.68 | -0.44 | 0.91 | -0.03 | 1.06 | 1.48 | 0.06 | 0.28 | 0.66 | 0.20 |
| 1960 | 0.38 | 0.06 | -0.40 | 0.18 | 1.03 | 1.02 | 1.64 | 1.88 | 0.04 | 0.29 | -0.53 | 1.46 | 0.59 |
| 1961 | 1.41 | 0.35 | 0.59 | -0.92 | -0.38 | 1.62 | -0.11 | 0.50 | 1.37 | -1.91 | -0.41 | -1.24 | 0.07 |
| 1962 | -0.07 | -0.18 | -0.43 | -1.30 | -1.36 | -1.01 | 0.06 | 0.60 | -0.95 | 1.06 | 0.57 | -0.08 | -0.26 |
| 1963 | 0.58 | 0.81 | -1.79 | -0.56 | -1.17 | 0.37 | -0.73 | -0.98 | 1.10 | 0.69 | -0.31 | 1.77 | -0.02 |
| 1964 | 0.16 | 1.24 | -1.04 | -1.09 | -2.68 | 0.15 | 0.66 | 0.86 | 1.15 | 0.58 | -0.81 | -1.73 | -0.21 |
| 1965 | -0.21 | -0.55 | -0.52 | -0.85 | -0.57 | 1.67 | -0.90 | 0.35 | 0.48 | 1.14 | -0.84 | -1.26 | -0.17 |
| 1966 | 0.39 | -1.31 | 0.74 | -0.31 | -0.27 | -0.01 | -0.81 | 1.29 | 0.81 | -0.70 | -2.04 | 0.09 | -0.18 |
| 1967 | -0.40 | 0.07 | -2.00 | -1.72 | -1.01 | -0.41 | -0.88 | -0.32 | 0.18 | 0.85 | -0.36 | -0.82 | -0.57 |
| 1968 | -0.88 | 1.05 | 0.44 | -0.89 | 0.17 | -0.18 | 0.41 | 1.33 | -0.99 | 0.26 | 0.88 | -1.44 | 0.01 |
| 1969 | -1.80 | -1.25 | 0.78 | 0.74 | 1.06 | 1.88 | 0.99 | -0.66 | 1.62 | 0.35 | 0.15 | 1.84 | 0.48 |
| 1970 | 0.60 | 0.98 | 0.81 | -0.43 | -0.66 | 0.11 | 1.24 | -0.57 | -0.42 | -1.01 | -1.19 | -0.79 | -0.11 |
| 1971 | -1.39 | 0.10 | 0.02 | 0.48 | 1.14 | 0.38 | -1.41 | -0.78 | 0.23 | -1.37 | -0.26 | -1.46 | -0.36 |
| 1972 | -1.41 | -1.48 | 0.20 | -1.76 | 0.14 | -0.24 | -0.76 | -0.01 | 0.21 | -1.50 | 0.56 | -0.56 | -0.55 |
| 1973 | -0.18 | 0.12 | 0.85 | 0.36 | 0.66 | 0.84 | 0.17 | -0.92 | -0.28 | -0.82 | -1.73 | 0.53 | -0.03 |
| 1974 | -0.69 | -0.90 | -0.82 | -0.50 | -0.55 | -1.38 | 0.35 | 0.93 | 0.47 | 0.69 | 0.57 | 0.68 | -0.10 |
| 1975 | -0.43 | -0.16 | -0.53 | -0.44 | 0.59 | -0.39 | -1.19 | -1.07 | -0.23 | -0.74 | -0.65 | 0.14 | -0.43 |
| 1976 | 0.31 | -1.56 | -1.52 | 1.19 | 0.56 | -1.34 | 0.32 | -0.59 | 0.00 | 0.68 | 1.81 | 0.51 | 0.03 |
| 1977 | 1.75 | 2.04 | -0.40 | -0.08 | -0.73 | 0.43 | -0.67 | 2.22 | -0.82 | 0.98 | -0.22 | -0.50 | 0.33 |
| 1978 | 0.61 | 1.27 | 0.12 | 0.05 | -0.92 | -0.97 | -2.15 | 0.05 | 1.71 | 0.48 | -0.49 | -0.72 | -0.08 |
| 1979 | -0.69 | -1.82 | 0.38 | 0.09 | 1.35 | -1.64 | 0.99 | 0.70 | 1.28 | 1.53 | 0.54 | -0.38 | 0.19 |
| 1980 | -0.28 | 1.74 | -0.35 | 1.96 | -0.28 | -0.86 | -0.42 | -1.99 | -0.05 | 2.45 | 1.35 | -0.27 | 0.25 |
| 1981 | 2.42 | 0.38 | 1.60 | -1.02 | 1.98 | -0.20 | -0.64 | -1.50 | 0.15 | -1.45 | 1.26 | -0.12 | 0.24 |
| 1982 | -0.86 | -0.68 | -1.40 | -1.89 | -0.70 | 1.93 | 0.97 | 0.34 | 1.05 | -0.93 | -0.48 | 0.75 | -0.16 |
| 1983 | 1.18 | 1.30 | 2.38 | 1.26 | -0.19 | 1.87 | 1.33 | 0.53 | -1.59 | 0.09 | 1.84 | -0.31 | 0.81 |
| 1984 | 0.97 | 0.77 | 1.41 | 1.70 | 0.32 | -0.44 | -2.34 | -1.11 | 0.03 | -0.63 | 0.42 | -1.60 | -0.04 |
| 1985 | 1.63 | -0.52 | -0.92 | -1.06 | -1.03 | 1.10 | 0.25 | -0.50 | -0.71 | -1.51 | -1.90 | 1.39 | -0.32 |
| 1986 | 0.97 | 0.53 | 0.83 | 0.09 | -0.13 | 0.26 | 0.07 | -1.45 | -0.29 | 0.92 | -0.73 | 1.37 | 0.20 |
| 1987 | 1.00 | 0.65 | 1.17 | 1.83 | -1.26 | 0.42 | -0.01 | 0.77 | -3.07 | 0.53 | 1.26 | 0.80 | 0.34 |
| 1988 | 0.53 | 1.25 | 0.69 | 1.40 | 0.60 | 1.13 | 2.16 | -0.59 | -1.11 | 0.66 | 0.13 | 0.63 | 0.62 |
| 1989 | -0.72 | -1.06 | -1.30 | -0.54 | -0.14 | -0.63 | -0.18 | -0.24 | 0.54 | -1.13 | -0.72 | 0.87 | -0.44 |
| 1990 | -0.34 | -1.86 | 0.34 | -0.39 | 0.21 | -1.41 | 0.17 | 1.79 | -0.50 | -0.97 | -1.73 | -1.32 | -0.50 |
| 1991 | 0.66 | 1.07 | -0.94 | 0.64 | -0.81 | -0.97 | 0.75 | -0.25 | 1.43 | -2.28 | 0.24 | 0.47 | 0.00 |
| 1992 | 1.28 | 0.29 | 0.77 | -0.05 | 1.27 | 1.17 | 0.85 | -0.34 | -1.31 | 0.21 | 0.85 | -1.23 | 0.31 |
| 1993 | -0.65 | 0.55 | 1.27 | 1.54 | 2.66 | 0.52 | 0.15 | -0.14 | -1.12 | -0.30 | -0.36 | 0.72 | 0.40 |
| 1994 | -0.12 | -0.73 | 0.54 | -0.47 | 0.45 | -1.38 | 0.38 | -1.34 | -2.38 | -0.23 | -1.67 | 0.69 | -0.52 |
| 1995 | 0.66 | 0.73 | 0.33 | 0.29 | 0.01 | 0.74 | -0.34 | -0.30 | 1.52 | -0.05 | -0.75 | 0.92 | 0.31 |
| 1996 | -0.02 | -0.30 | -0.47 | 0.77 | 0.32 | -1.21 | 0.64 | -0.90 | -0.28 | -0.76 | -0.45 | -1.23 | -0.32 |
| 1997 | 0.63 | 0.56 | -1.30 | 0.55 | 0.78 | -0.34 | 0.56 | -0.52 | 0.31 | -0.26 | 0.91 | 1.16 | 0.25 |
| 1998 | 0.74 | 0.89 | 1.01 | 1.12 | -2.22 | -0.02 | 2.24 | -0.57 | 0.55 | 0.55 | 0.74 | -0.09 | 0.41 |
| 1999 | 0.16 | -0.12 | 0.69 | 0.30 | -0.15 | 0.30 | -0.54 | 1.97 | 0.44 | 0.41 | 0.48 | 0.21 | 0.35 |
| 2000 | -0.82 | 1.12 | 1.28 | -0.35 | -0.28 | -1.22 | -2.28 | -0.48 | -1.40 | 0.25 | 0.74 | 1.23 | -0.18 |
| 2001 | 1.51 | -0.16 | 0.70 | -0.47 | -0.11 | -0.94 | 0.06 | -0.11 | 0.10 | -0.22 | 1.09 | 0.56 | 0.17 |
| 2002 | -0.04 | 0.14 | -1.30 | -2.22 | -0.73 | -0.05 | 0.88 | 0.64 | 0.77 | -0.65 | 1.54 | 1.59 | 0.05 |
| 2003 | 1.29 | 0.73 | -0.07 | 0.14 | -2.20 | -0.60 | 1.23 | -0.28 | 0.76 | 0.97 | -1.72 | 0.86 | 0.09 |
| 2004 | 0.41 | 1.06 | 0.30 | 0.51 | -1.76 | -0.37 | 0.09 | 1.55 | -0.08 | -1.39 | 0.31 | 0.26 | 0.07 |
| 2005 | 0.02 | 0.14 | 0.88 | 1.28 | 1.74 | 0.29 | 0.43 | 0.72 | 1.63 | 0.90 | -0.76 | 1.38 | 0.72 |
| 2006 | 0.43 | -0.11 | -0.27 | 0.45 | -1.27 | -1.06 | 1.83 | -1.41 | 0.42 | -0.84 | -1.39 | 1.86 | -0.11 |
| 2007 | 0.72 | -0.09 | 0.18 | 1.25 | -0.06 | -0.38 | 2.21 | 1.98 | 1.88 | 0.55 | 0.69 | 0.14 | 0.76 |
| 2008 | -0.32 | 0.50 | -0.32 | -0.97 | 1.33 | -1.75 | -0.10 | 0.92 | 1.12 | 0.86 | 1.11 | -1.41 | 0.08 |
| 2009 | 0.61 | -0.95 | -1.02 | 0.21 | -0.58 | 0.35 | 1.22 | 0.65 | 1.29 | 0.43 | 0.21 | 0.34 | 0.23 |
| 2010 | 1.25 | 0.58 | 2.02 | 1.54 | -0.93 | -0.20 | 1.40 | 1.10 | 1.34 | 1.80 | -0.84 | -1.78 | 0.61 |
| 2011 | 1.29 | -1.58 | 0.69 | -1.59 | 0.19 | 0.22 | -0.35 | 1.42 | -0.42 | 0.63 | -0.79 | 0.36 | 0.01 |
| 2012 | 0.60 | 0.75 | 0.11 | 0.15 | -0.42 | -0.50 | -0.16 | -0.17 | -0.42 | -1.18 | -1.10 | -1.01 | -0.28 |
| 2013 | 0.55 | 0.45 | 0.04 | -1.56 | -0.36 | -0.43 | -0.31 | -0.03 | 0.54 | -0.34 | -1.18 | -0.86 | -0.29 |
| 2014 | 0.97 | -0.95 | -0.21 | 0.25 | -0.76 | -1.46 | 0.99 | 1.37 | 0.99 | 0.89 | 0.68 | 0.67 | 0.29 |
| 2015 | 0.61 | 0.59 | -0.23 | -0.15 | -0.16 | -0.17 | 0.76 | 0.08 | -0.92 | 1.78 | -0.19 | 0.78 | 0.23 |
| 2016 | 2.02 | 1.48 | 0.73 | 0.87 | -1.06 | -0.70 | 1.02 | -0.88 | 0.18 | 1.24 | 1.52 | -0.35 | 0.51 |
| 2017 | 0.28 | 0.18 | 0.27 | 0.40 | -0.31 | 1.01 | 1.86 | 0.23 | -0.33 | -0.40 | -2.06 | 0.89 | 0.17 |
| 2018 | 0.40 | -1.03 | -0.89 | -0.91 | -1.34 | 0.51 | -0.37 | 1.27 | 1.44 | 0.21 | 0.24 | 0.86 | 0.03 |
| 2019 | 0.83 | -1.08 | 0.25 | -0.61 | -0.29 | 0.12 | 1.11 | 1.18 | 2.00 | -1.02 | -0.06 | 0.18 | 0.22 |
| 2020 | -0.24 | 0.17 | -1.18 | 0.21 | 0.70 | 1.73 | 1.82 | 0.75 | -1.13 | 0.24 | 1.58 | 0.19 | 0.40 |
| 2021 | 0.19 | -0.31 | -0.97 | -1.05 | -1.35 | 0.67 | 0.56 | 0.95 | 0.44 | 1.13 | 0.72 | -2.56 | -0.13 |
| 2022 | 1.01 | 0.66 | 0.13 | -0.74 | -0.83 | -0.31 | 2.54 | 0.79 | 0.21 | 0.17 | -0.73 | -0.66 | 0.19 |
| 2023 | 0.21 | -0.64 | -1.63 | -0.42 | -0.86 | 0.69 | 1.15 | 0.45 | 1.06 | 1.20 | 0.55 | 1.21 | 0.25 |
| 2024 | 0.45 | 0.09 | 0.45 | -0.65 | -2.74 | 0.97 | 2.60 | -1.01 | 1.34 | -0.04 | 0.60 | 1.70 | 0.31 |
| 2025 | 1.05 | 1.41 | -0.10 | -0.87 | -1.67 | -1.11 | 0.74 | -0.36 | 0.81 | 1.42 | 0.79 | -1.41 | 0.06 |
| 2026 | 0.79 | -0.56 | -1.74 | -1.26 | -1.27 | -0.50 | 0.61 | -0.08 | -0.50 | ||||
| Avg | 0.220 | 0.019 | -0.041 | -0.081 | -0.221 | -0.052 | 0.306 | 0.155 | 0.197 | 0.092 | -0.015 | 0.077 | 0.055 |
| Max | 2.420 | 2.040 | 2.380 | 1.960 | 2.660 | 1.930 | 2.598 | 2.220 | 2.000 | 2.450 | 1.840 | 1.860 | 2.197 |
| Min | -2.340 | -1.860 | -2.230 | -2.700 | -2.741 | -1.970 | -2.340 | -1.990 | -3.070 | -2.280 | -2.060 | -2.070 | -2.304 |
| Month | Jan | Feb | Mar | Apr | May | Jun | Jul | Aug | Sep | Oct | Nov | Dec | Avg |
| Data: https://www.cpc.ncep.noaa.gov/products/precip/CWlink/pna/norm.pna.monthly.b5001.current.ascii | |||||||||||||
Never base important decisions on this or any weather information obtained from the Internet.
Always have a backup method of receiving weather information such as a battery powered weather radio.
Copyright © 2026 DaculaWeather.com
