Eastern Pacific Oscillation Index (EPO)
Data Courtesy Climate Data Center


AO Index | AMOC Index | ENSO | EPO Index | MEIv2 Index | NAO Index | PDO Index | PNA Index | QBO Index | Teleconnection Monthly Summary
1950's | 1960's | 1970's | 1980's | 1990's | 2000's | 2010's | 2020's
ENSO and Snowfall Earth | 1960's | 1970's | 1980's | 1990's | 2000's | 2010's | 2020's
Eastern Pacific Oscillation Index (EPO)
The Eastern Pacific Oscillation or EPO is a dipole pattern similar to the NAO in the Atlantic, but located in the eastern Pacific. There is a tendency for heights/pressures/temperatures to be higher to the north and lower to the south in the negative phase and lower to the north and higher to the south in the positive phase. The negative phase corresponds to widespread cooling over central and eastern North America and the positive phase to warming.tial heights , which are also referred to as negative geopotential height anomalies , and a negative phase in which the opposite is true.
Negative EPO
The EPO pattern will become very important during winter because the negative phase of the pattern opens the door to very cold Arctic and Siberian air into the US. Notice in this configuration how you have high pressure over low pressure off the west coast of the US. The next time you're looking at computer models, make a note of what the pressures are in the east Pacific, and especially look for this pattern this winter. Here's an image that depicts the negative phase of the EPO.

Positive EPO
The weather pattern in the positive phase of this teleconnection is just the opposite of the negative (of course!), and in this case, you have low pressure over high pressure across the eastern half of the country which gives the central and eastern US a different outcome.

Plotted EPO Timeseries
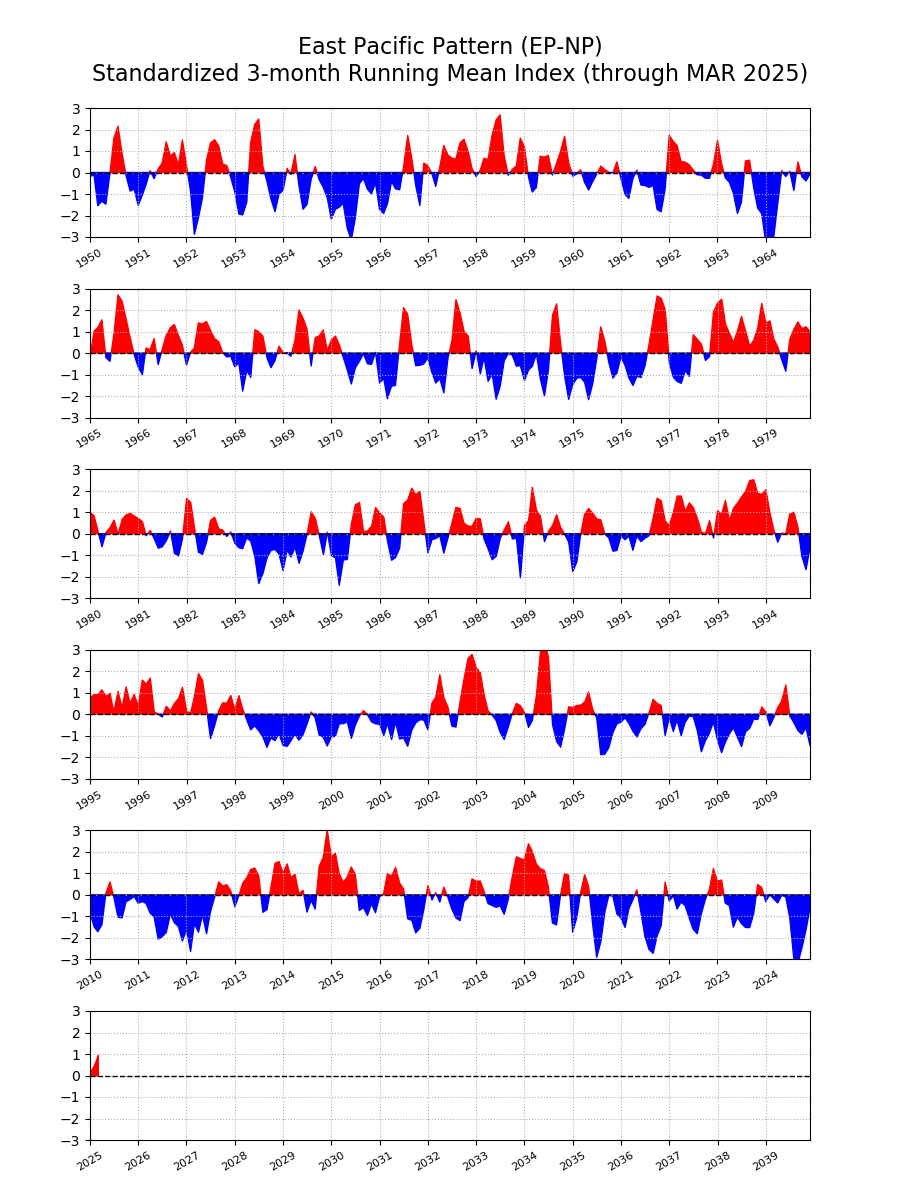
EPO Values by Year and Month
| Eastern Pacific Oscillation | Updated: | 9/26/2026 | |||||||||
| Year | Jan | Feb | Mar | Apr | May | Jun | Jul | Aug | Sep | Oct | Nov |
| 1950 | 0.91 | -1.13 | -0.02 | -1.87 | -0.98 | -0.47 | 1.38 | 1.87 | 0.98 | -0.88 | -0.39 |
| 1951 | -0.81 | -1.32 | 0.20 | 0.02 | -0.04 | -0.62 | 0.98 | 0.41 | 1.42 | -0.11 | 0.62 |
| 1952 | 1.59 | -1.09 | -2.13 | -2.44 | 0.06 | -0.25 | 1.30 | 1.35 | 0.35 | 1.10 | -0.62 |
| 1953 | 0.24 | -1.51 | -2.29 | -0.07 | -0.63 | 3.88 | 0.99 | -0.54 | 0.12 | -0.52 | -2.15 |
| 1954 | 0.60 | -1.75 | 1.51 | 0.08 | 0.20 | -1.64 | -1.79 | 0.83 | 0.31 | -0.53 | -0.48 |
| 1955 | -1.32 | -1.71 | -0.13 | -1.35 | -1.61 | -2.84 | -1.49 | 0.61 | -0.15 | -1.09 | -0.37 |
| 1956 | -0.39 | -1.99 | -1.13 | 0.29 | -0.05 | -1.95 | 0.48 | 1.92 | 0.98 | -1.43 | -0.82 |
| 1957 | 1.42 | -0.98 | -0.56 | 0.26 | 0.85 | 1.71 | -1.03 | 0.49 | 1.78 | 0.84 | 0.60 |
| 1958 | -0.38 | 0.13 | 0.45 | 0.73 | 0.11 | 3.00 | 1.51 | 0.14 | -0.13 | -0.29 | 0.73 |
| 1959 | 1.62 | 0.04 | -2.03 | 0.22 | 0.30 | 1.19 | -0.14 | 0.34 | -0.43 | 1.03 | 1.43 |
| 1960 | -0.76 | 0.52 | 0.12 | -0.39 | -0.74 | -0.71 | 0.65 | -0.08 | 0.02 | 0.38 | -0.40 |
| 1961 | 1.09 | -1.50 | -1.47 | 0.60 | 0.26 | -0.61 | -0.76 | 0.31 | -0.91 | -0.75 | -1.92 |
| 1962 | 0.74 | 1.66 | 0.25 | 0.56 | 0.26 | 0.26 | 0.16 | -0.22 | -0.15 | 0.10 | -0.50 |
| 1963 | 1.00 | 1.07 | -1.31 | -0.25 | 0.57 | -2.46 | -1.71 | 1.74 | 1.02 | -1.47 | -0.95 |
| 1964 | -1.95 | -2.52 | -1.39 | -2.03 | 0.33 | 1.90 | -2.58 | 0.78 | 0.16 | 0.17 | -0.74 |
| 1965 | 0.60 | -0.93 | 2.23 | 1.02 | 0.07 | -1.56 | 0.75 | 2.32 | 2.26 | 0.85 | 0.21 |
| 1966 | -0.36 | -0.55 | -0.94 | 1.96 | -0.67 | 0.23 | -0.57 | 0.63 | 1.58 | 0.46 | 0.74 |
| 1967 | -0.22 | -0.56 | 0.87 | 0.14 | 2.02 | 0.88 | -0.12 | 1.10 | 0.35 | -0.24 | -0.03 |
| 1968 | -0.24 | -0.65 | 0.05 | -2.88 | 1.07 | -0.73 | 1.71 | 0.75 | -0.91 | -0.33 | -0.16 |
| 1969 | 0.60 | -0.58 | -0.02 | 0.32 | 1.00 | 3.19 | -1.13 | -0.14 | 0.09 | 1.67 | -0.11 |
| 1970 | 0.23 | 0.61 | 0.62 | -0.45 | -0.57 | -0.72 | -1.42 | 0.93 | -0.27 | -0.72 | -0.05 |
| 1971 | 0.05 | -1.99 | -0.22 | -1.95 | -1.14 | -0.28 | 2.19 | 1.78 | -0.39 | -0.49 | -0.34 |
| 1972 | -0.46 | 0.15 | -1.36 | -1.52 | 0.31 | -2.96 | 2.20 | 1.76 | 0.93 | 1.48 | -0.32 |
| 1973 | -0.80 | 0.95 | -1.94 | 0.60 | -1.49 | -1.30 | -1.27 | -0.10 | 0.68 | -0.62 | -0.27 |
| 1974 | -0.65 | -1.12 | 0.32 | -0.41 | 0.03 | -2.29 | -1.52 | 2.42 | 2.56 | 0.18 | -1.75 |
| 1975 | -1.52 | -0.50 | -0.14 | -1.57 | -1.21 | -2.09 | 0.60 | 0.99 | 0.81 | -0.56 | -1.14 |
| 1976 | -0.30 | 0.07 | -0.83 | -1.52 | -0.90 | -0.03 | -1.21 | 0.23 | 1.82 | 1.53 | 2.19 |
| 1977 | 0.75 | -1.40 | -1.44 | 0.25 | -1.84 | -0.24 | 0.03 | 1.69 | -0.47 | -0.29 | 0.05 |
| 1978 | 2.76 | 0.48 | 1.38 | 0.82 | -0.23 | 0.50 | 1.70 | 0.77 | -0.48 | 0.43 | 1.28 |
| 1979 | 2.12 | -0.18 | 0.83 | 0.66 | -0.87 | -0.48 | -0.24 | 1.82 | 0.58 | 0.87 | 0.92 |
| 1980 | 0.53 | 0.86 | 0.15 | -0.75 | -0.70 | 1.59 | -0.35 | -0.15 | 0.43 | 1.24 | 0.15 |
| 1981 | 1.02 | -0.03 | 0.03 | -0.19 | 0.48 | -0.82 | -0.94 | 0.70 | -0.40 | -0.01 | -1.50 |
| 1982 | 1.11 | 1.16 | 0.41 | -0.98 | -1.29 | 0.10 | 0.44 | 0.54 | 0.54 | -0.57 | 0.38 |
| 1983 | -0.31 | -0.31 | -0.60 | -0.46 | 0.63 | -0.95 | -1.67 | -1.43 | -0.56 | -0.57 | -0.50 |
| 1984 | -0.97 | -1.41 | 0.98 | -1.70 | -0.64 | -0.76 | -0.10 | 0.85 | 1.25 | -0.49 | -0.94 |
| 1985 | 1.00 | -2.41 | -0.67 | -1.64 | -0.31 | -0.75 | 1.93 | 1.15 | -0.22 | -0.75 | 1.25 |
| 1986 | 0.52 | 0.83 | 0.07 | -1.56 | -1.17 | 0.23 | -0.35 | 2.55 | 0.87 | 1.35 | 1.54 |
| 1987 | -0.74 | -0.49 | 0.73 | -0.68 | -0.26 | -1.09 | 0.94 | 0.97 | 0.49 | 1.20 | -0.67 |
| 1988 | 1.13 | -0.13 | 0.26 | -0.63 | -1.16 | -0.93 | 0.10 | 0.44 | -0.19 | 0.99 | -1.31 |
| 1989 | -1.81 | 2.34 | 0.60 | 1.29 | 0.45 | 0.09 | -1.23 | 1.32 | 0.66 | 0.00 | -0.04 |
| 1990 | -0.58 | -1.86 | 0.03 | 1.72 | 0.21 | 0.71 | 0.88 | -0.39 | 0.78 | -0.43 | -0.76 |
| 1991 | -0.45 | 0.31 | -0.38 | -0.14 | -1.13 | 1.02 | -0.58 | -0.81 | 1.20 | 1.24 | 1.01 |
| 1992 | -0.17 | 0.70 | 1.28 | 1.46 | 1.02 | -0.14 | 1.83 | 0.43 | -0.87 | 0.59 | 0.30 |
| 1993 | -0.65 | 2.12 | 0.21 | 0.71 | 0.37 | 1.59 | 0.73 | 0.66 | 2.48 | 2.44 | 0.31 |
| 1994 | 2.38 | 0.47 | -1.06 | 0.98 | -0.76 | -0.14 | 0.90 | 0.83 | 0.24 | -0.40 | -2.04 |
| 1995 | 1.03 | 0.05 | 0.61 | 1.13 | 0.72 | 0.02 | 1.11 | -0.92 | 1.90 | -0.32 | 1.07 |
| 1996 | 0.26 | 0.27 | 2.41 | 0.07 | 1.15 | -0.96 | -0.17 | 0.92 | -0.02 | -0.54 | 1.61 |
| 1997 | 0.22 | -0.03 | -0.06 | 1.70 | 2.43 | -0.56 | -1.32 | -0.08 | 0.36 | 0.10 | 0.65 |
| 1998 | 0.62 | -0.33 | 1.31 | -0.49 | -1.36 | 0.23 | 0.12 | -1.67 | -0.52 | -1.27 | -0.52 |
| 1999 | -0.89 | -1.12 | -0.73 | -0.57 | -0.69 | -1.44 | 0.34 | 0.32 | -0.44 | -0.24 | -1.33 |
| 2000 | -0.92 | -0.55 | -0.40 | 0.08 | -0.62 | -0.24 | -1.26 | 0.63 | 0.49 | -0.72 | 0.20 |
| 2001 | -0.90 | 0.26 | -1.16 | 0.06 | -1.42 | 0.55 | -1.30 | -1.17 | -0.46 | -0.04 | -0.33 |
| 2002 | -0.11 | -0.89 | 1.99 | 0.45 | 1.52 | -0.20 | -0.69 | -0.07 | -0.40 | 1.77 | 2.05 |
| 2003 | 2.07 | 0.94 | 0.56 | 0.34 | -0.57 | 0.17 | -0.14 | -1.46 | -0.70 | 0.85 | -0.11 |
| 2004 | 0.66 | -0.50 | -1.28 | 1.23 | 1.92 | 3.36 | 1.19 | 0.07 | -2.21 | -0.71 | -0.26 |
| 2005 | 0.73 | -0.29 | 0.31 | 0.81 | 0.09 | 1.43 | -1.11 | -0.60 | -1.98 | -1.60 | 0.35 |
| 2006 | -1.07 | 0.57 | 0.20 | -1.57 | -0.31 | -0.49 | -0.46 | 0.13 | 0.47 | 0.97 | -0.38 |
| 2007 | -1.14 | 0.93 | -1.27 | -0.19 | -0.67 | 0.00 | 0.49 | -0.67 | -1.29 | -1.96 | 0.68 |
| 2008 | -1.25 | -0.40 | -1.62 | -0.50 | 0.21 | -1.13 | -1.13 | -0.36 | -0.11 | -1.00 | 0.65 |
| 2009 | -0.18 | 0.32 | -1.12 | 0.49 | 1.31 | -0.39 | 1.65 | -1.39 | -1.02 | 0.70 | -1.62 |
| 2010 | -0.58 | -0.51 | -1.63 | -1.21 | -0.15 | 1.50 | -0.22 | -1.48 | -0.34 | -0.58 | 0.27 |
| 2011 | -0.42 | -0.12 | -0.03 | -0.63 | -1.18 | -0.48 | -2.23 | -0.67 | -0.53 | -0.81 | -1.34 |
| 2012 | -1.92 | -0.33 | -2.59 | 0.31 | -1.46 | -0.95 | -1.01 | 0.63 | 0.16 | 0.58 | 0.12 |
| 2013 | 0.12 | -0.88 | 0.70 | 1.24 | -0.26 | 1.68 | 0.93 | -1.09 | -1.44 | 0.99 | 1.16 |
| 2014 | 1.11 | 0.31 | 1.24 | 0.05 | 0.77 | -0.69 | 0.33 | -1.03 | 0.20 | -0.66 | 3.21 |
| 2015 | 1.27 | 1.18 | 1.13 | -0.35 | 0.49 | 1.72 | 0.23 | -0.28 | -1.38 | 0.33 | -0.94 |
| 2016 | -0.35 | 0.23 | 0.24 | 1.47 | 0.14 | 1.26 | -0.36 | -0.42 | -1.41 | -0.84 | -1.43 |
| 2017 | 0.39 | 0.21 | -1.04 | 1.04 | -0.72 | 0.50 | 0.00 | -1.65 | -0.46 | -0.58 | 0.41 |
| 2018 | 0.66 | 0.23 | 0.30 | -0.18 | -0.98 | 0.05 | -0.16 | -0.78 | -0.83 | 1.17 | 1.42 |
| 2019 | 1.07 | 1.20 | 2.11 | 0.67 | 0.32 | 1.74 | 0.10 | -1.18 | -1.50 | -0.47 | 1.93 |
| 2020 | -0.60 | -1.79 | 0.44 | 1.54 | 0.04 | -0.69 | -1.97 | -2.39 | 0.06 | 0.57 | -0.66 |
| 2021 | -0.71 | -0.80 | -1.29 | 0.80 | 0.00 | -0.26 | -1.28 | -1.82 | -1.89 | -2.42 | 0.34 |
| 2022 | 0.51 | -0.90 | 0.35 | -0.73 | -0.34 | -0.04 | -1.64 | -1.11 | -0.81 | -0.06 | 0.42 |
| 2023 | 1.36 | -0.47 | 0.39 | -0.67 | -0.79 | -1.92 | 0.76 | -1.16 | -2.58 | 0.31 | 0.39 |
| 2024 | 0.08 | -0.51 | 0.47 | -0.33 | -0.95 | 1.25 | -0.49 | -2.62 | -2.75 | -1.78 | -0.59 |
| 2025 | -0.35 | 0.58 | 0.67 | -0.61 | -1.65 | 0.97 | 0.44 | -2.22 | -1.54 | -1.70 | 1.31 |
| 2026 | 0.38 | -0.47 | -1.17 | 0.68 | -0.65 | 1.57 | -2.47 | ||||
| https://psl.noaa.gov/data/correlation/epo.data | |||||||||||
Never base important decisions on this or any weather information obtained from the Internet.
Always have a backup method of receiving weather information such as a battery powered weather radio.
Copyright © 2026 DaculaWeather.com
