Prognostic Discussion for 6 to 10 and 8 to 14 day outlooks
NWS Climate Prediction Center College Park, MD
300 PM EDT Sat October 10 2026
6-10 DAY OUTLOOK FOR OCT 16 - 20 2026
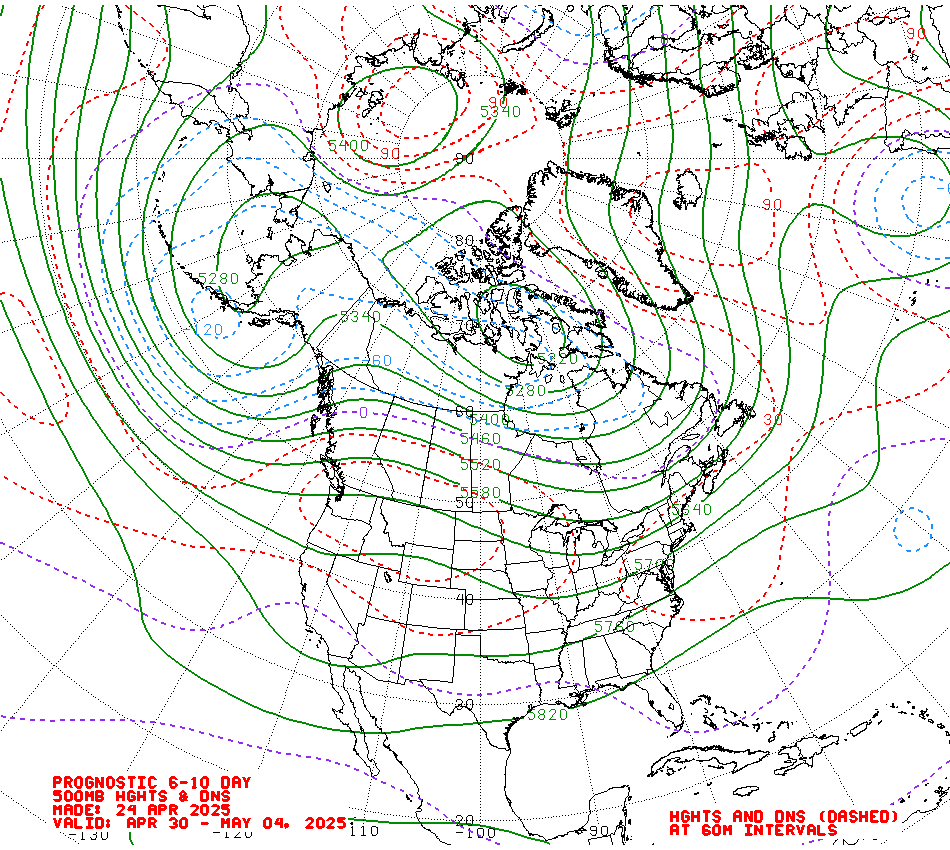
The 0z ECMWF, GEFS, and Canadian ensemble solutions for 500-hPa height
anomalies are in good agreement with regard to the synoptic picture over North
America and adjacent regions during the 6-10 day period, depicting moderate
troughing over the Gulf of Alaska and eastern Canada, and positive height
anomalies across the Contiguous U.S. (CONUS) and much of central Canada. During
the extended range forecast period one or more shortwave troughs are depicted
moving across the CONUS, bringing brief pulses of precipitation and transient
cold periods over the eastern two thirds of the Lower 48.
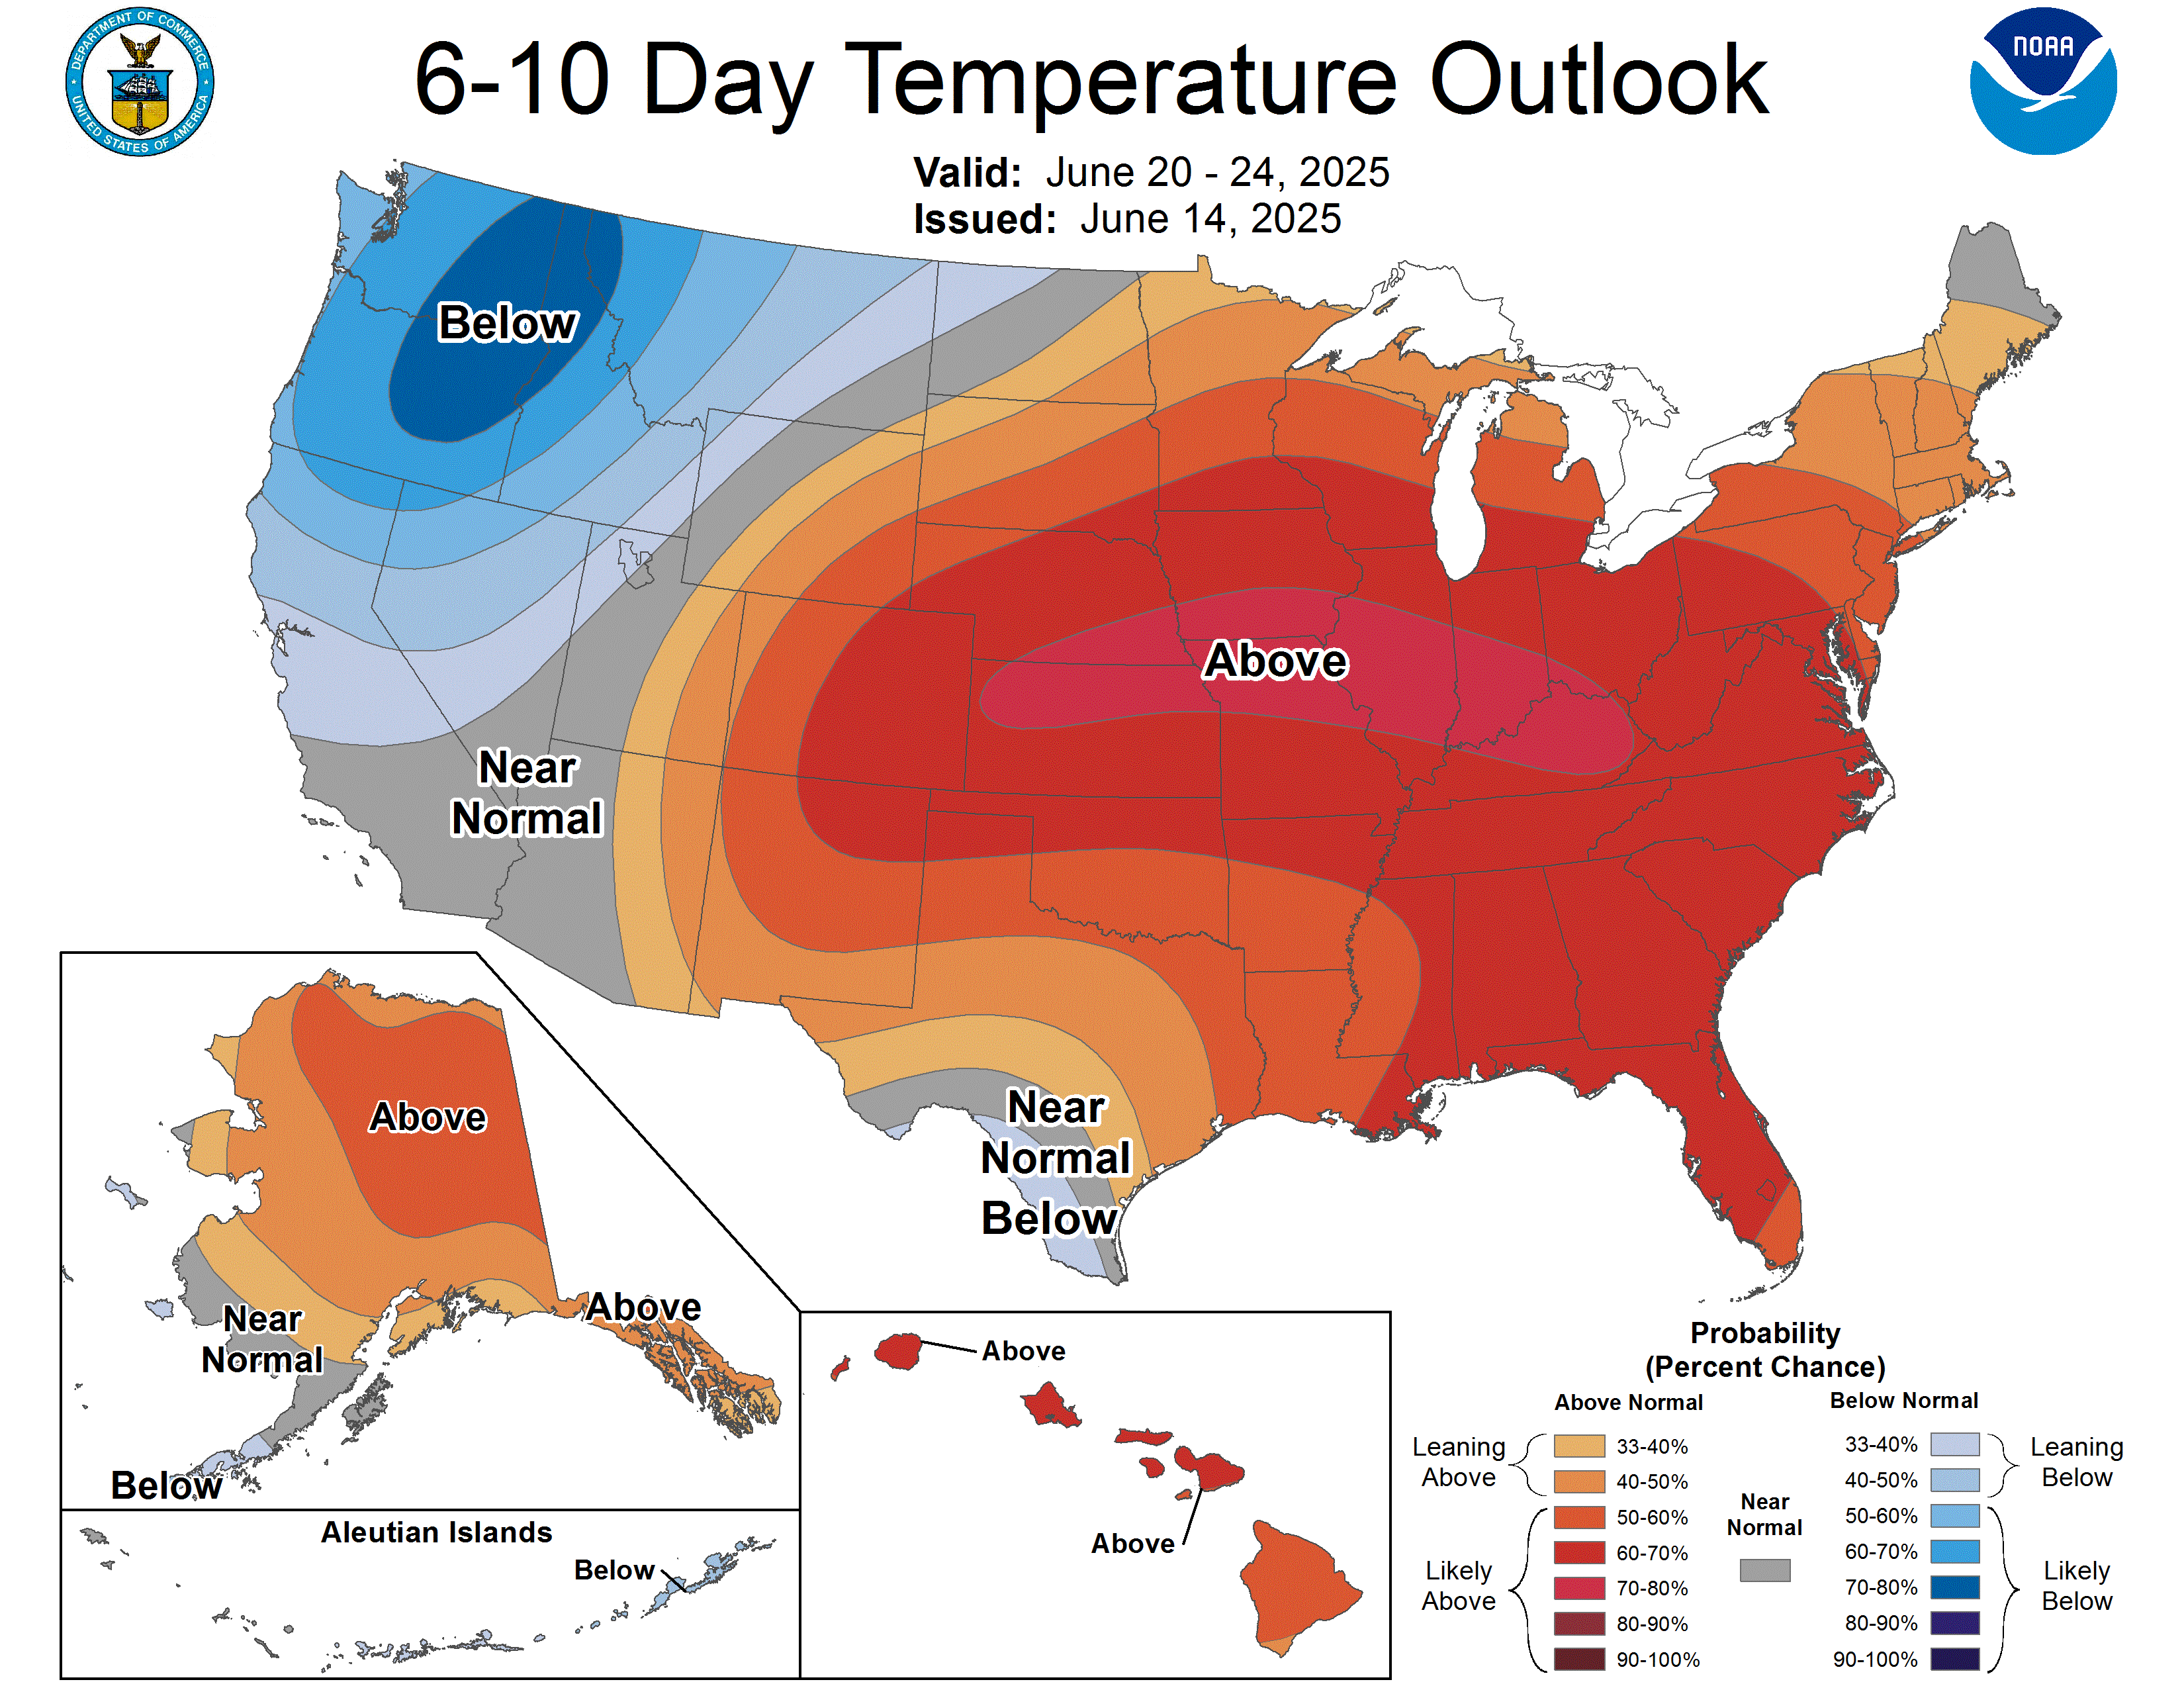
Widespread positive height anomalies over much of North America generally favor
above-normal temperatures across much of the CONUS. Odds are enhanced to
above50% across the West and the Northern Plains, and above 60% for much of
California and adjacent portions of Nevada and Arizona and over the northern
High Plains, under the ridge axis and largest height anomalies. Early in the
forecast period a shortwave trough is favored to bring increased cloudiness to
the country's midsection and tilting portions of the Southern Plains towards
near- to below-normal temperatures. Near- to below-normal temperatures are also
favored for much of the Northeast in northerly flow upstream of troughing over
eastern Canada. In Alaska, troughing over the Gulf of Alaska leads to a tilt
towards above-normal temperatures for southeastern Alaska, and below-normal
along the Mainland's western coast. Anomalously warm sea surface temperatures
in the region keep Hawaii tilting towards above-normal temperatures.
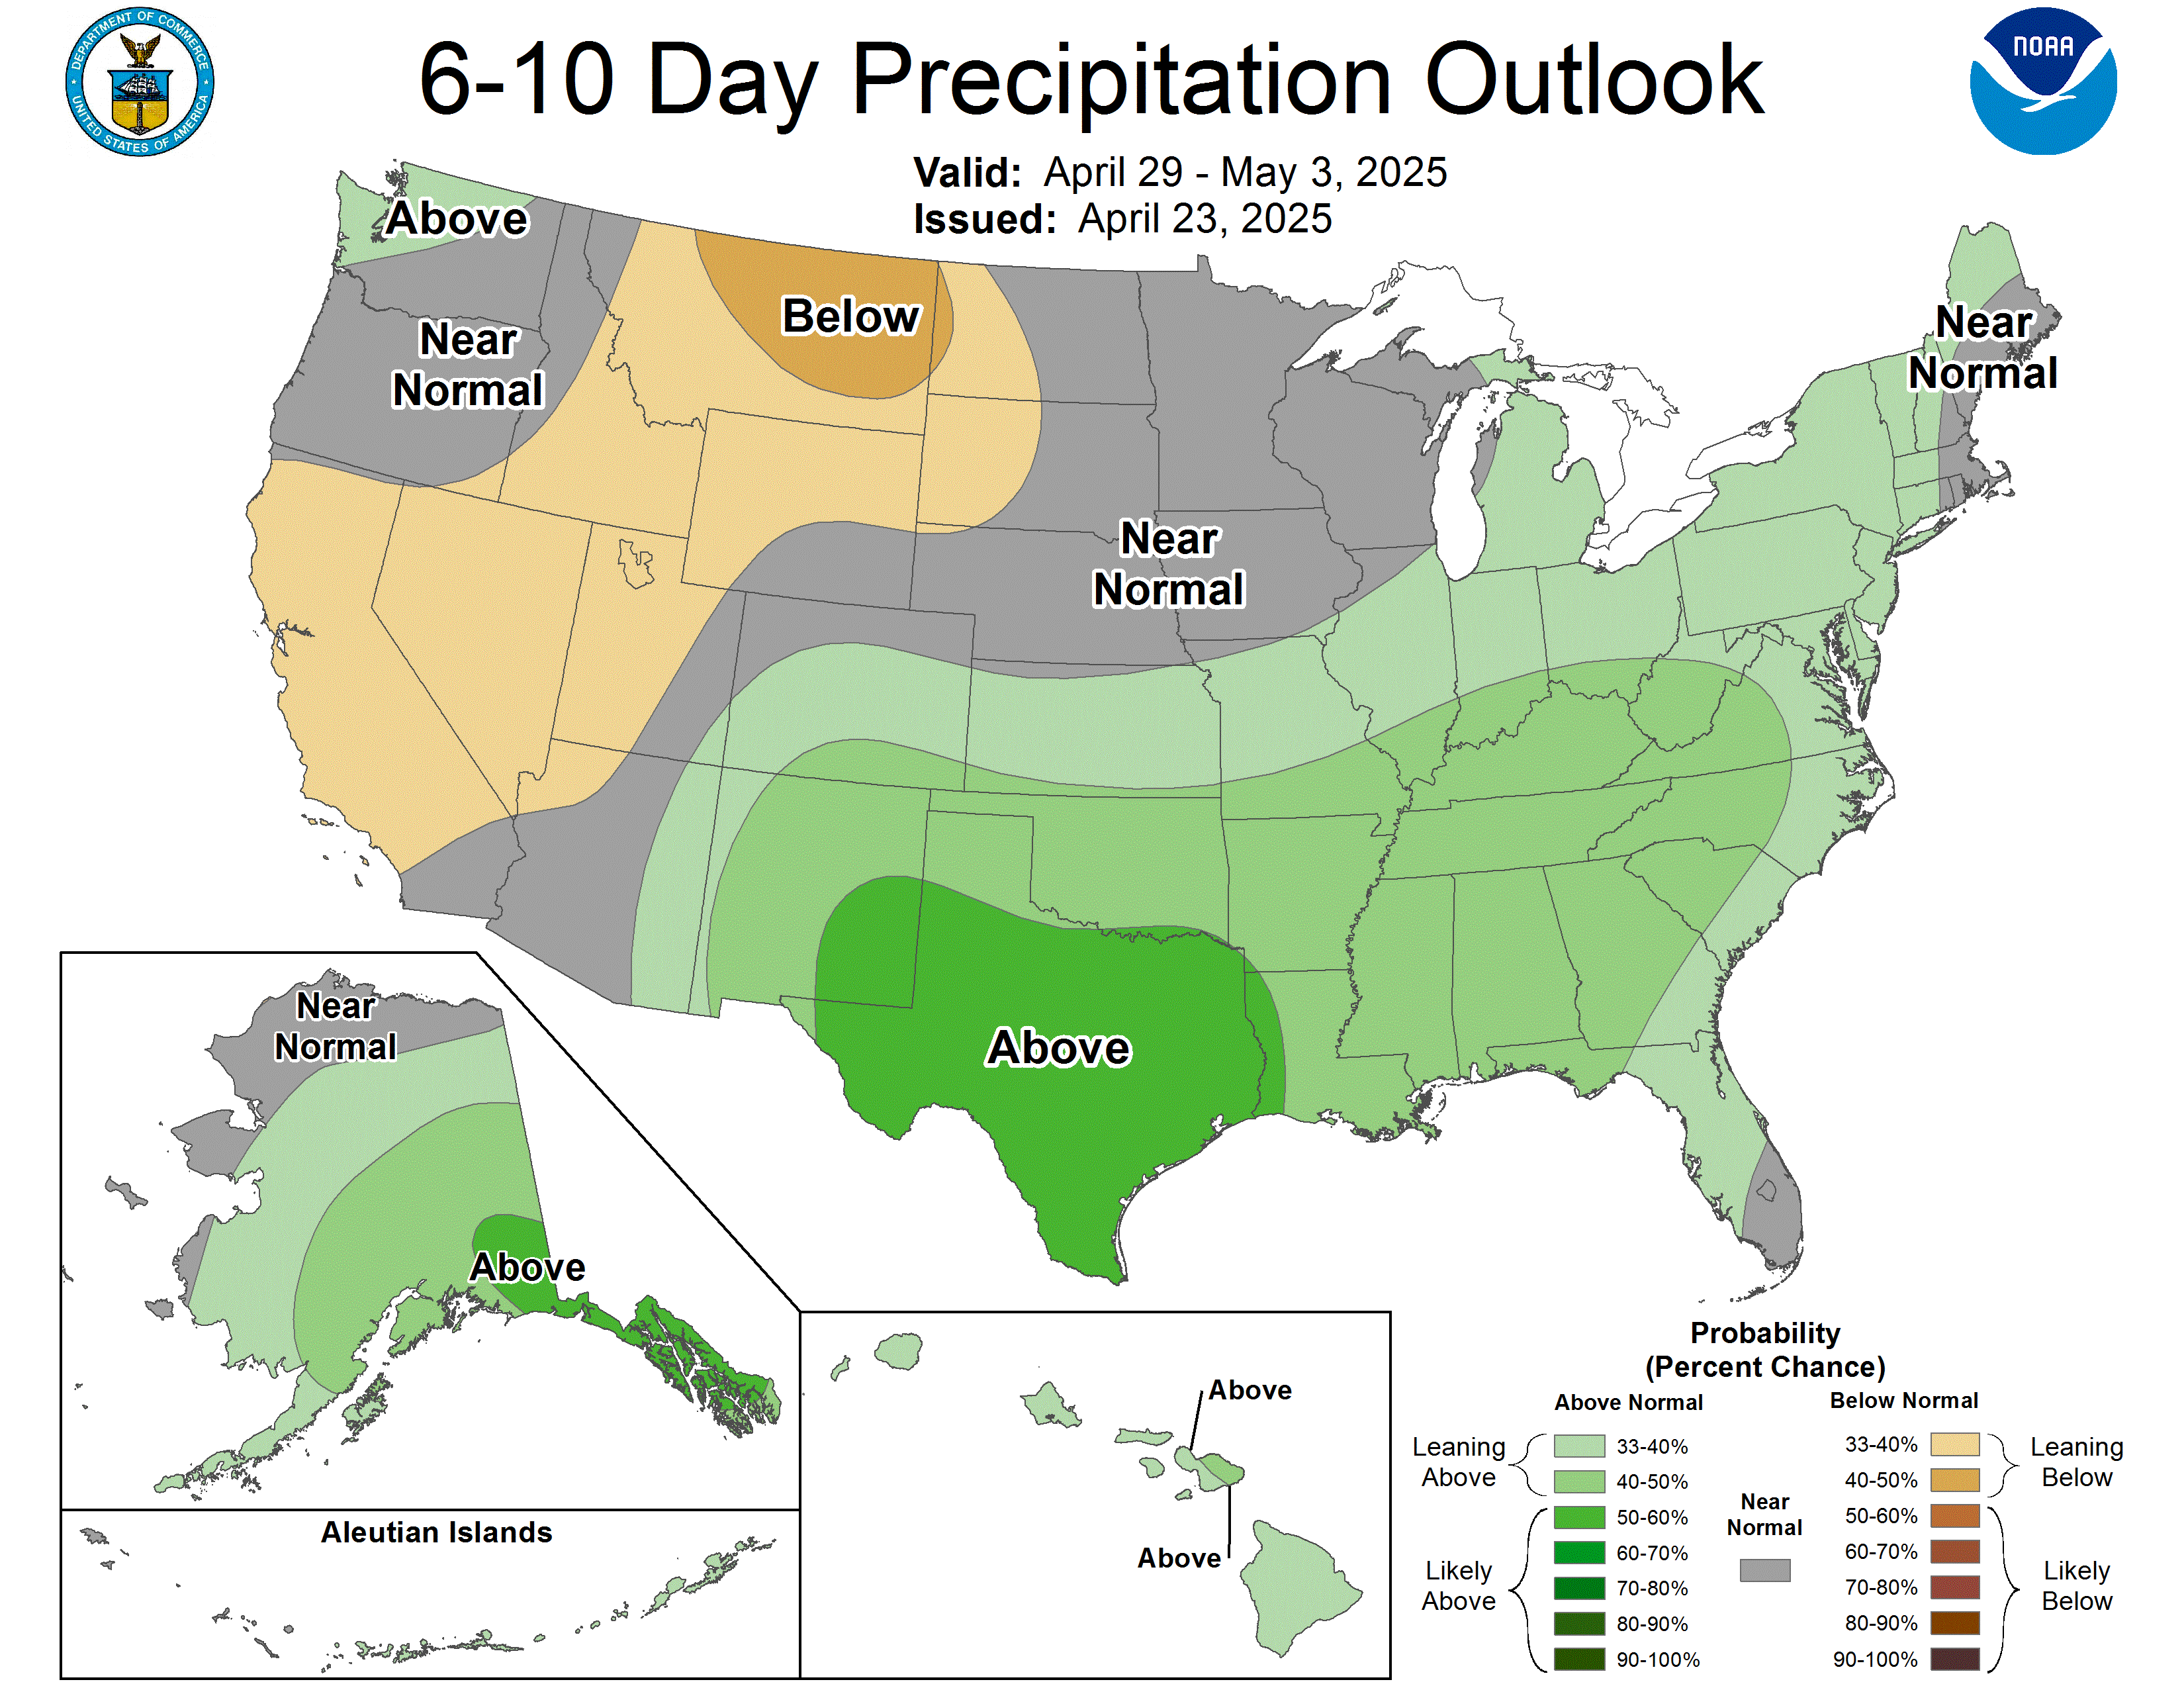
A passing shortwave trough early in the period and a potential stalled front
over the southern CONUS favor above-normal precipitation for southern portions
of the Lower 48 from southeastern Arizona across the Rio Grande Valley and Gulf
Coast. With widespread positive height anomalies across North America filling
in behind the trough, the potential for precipitation drops, leading to
widespread below-normal precipitation being indicated for much of the Northern
Tier under building positive height anomalies. The depicted Pacific storm track
is positioned sufficiently south to tilt portions of the Pacific Northwest
towards near- to above-normal precipitation. Moderate troughing over the Gulf
of Alaska tilts the odds towards above-normal precipitation for the eastern
Mainland and Southeast Alaska, while near-normal precipitation is indicated for
the remainder of the state. The Pacific tropics continue to be quite active at
least partially due to forcing from El Nino, and Hawaii remains favored for
above-normal precipitation.
The official 6-10 day 500-hPa height blend consists of 33% of Today's 0z GFS
Ensemble Mean centered on Day 8, 34% of Today's 0z European Ensemble Mean
centered on Day 8, and 33% of Today's 0z Canadian Ensemble Mean centered on Day
8
FORECAST CONFIDENCE FOR THE 6-10 DAY PERIOD: Above average, 4 out of 5, due to
good agreement between model forecasts of the mean large-scale mid-level height
pattern, offset by uncertainty regarding shortwave trough evolution during the
forecast period.
8-14 DAY OUTLOOK FOR OCT 18 - 24 2026
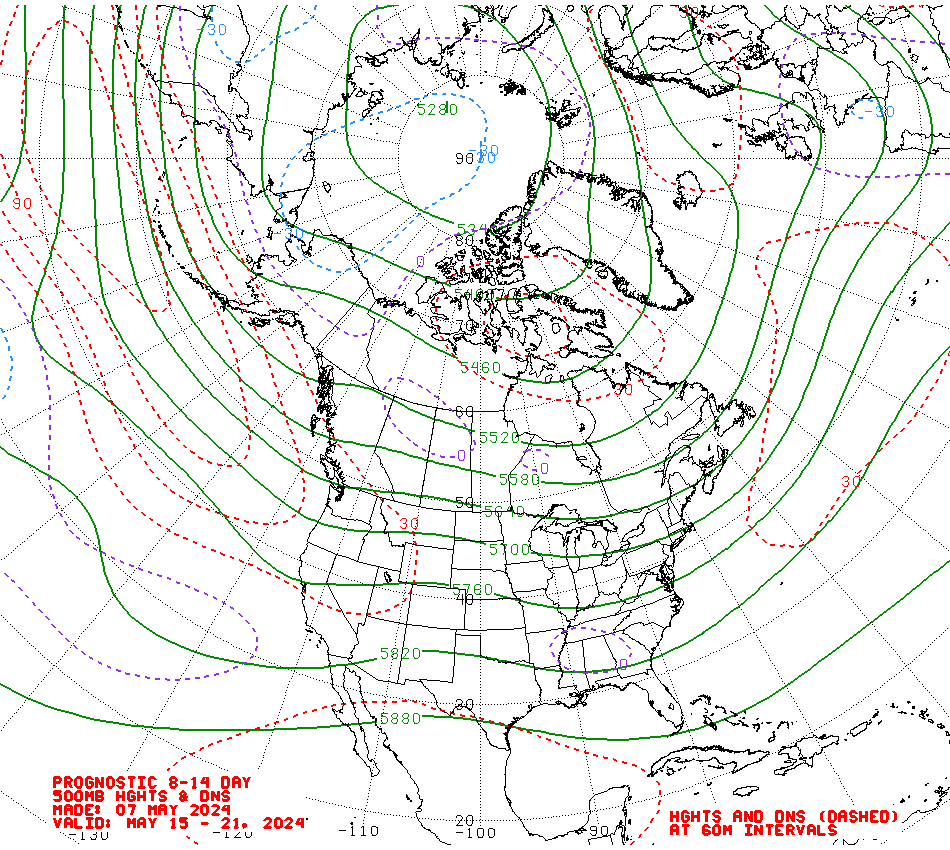
The overall predicted 500-hPa height pattern in the 8-14 day period ensemble
model forecasts are very similar to the 6-10 day period, with the main
difference being that troughing over the North Pacific and eastern Canada are
both weaker in the week-2 500-hPa height anomalies manual blend. Both the
magnitude and extent of positive height anomalies over the CONUS are reduced as
well, but to a lesser degree than the reduced troughing.
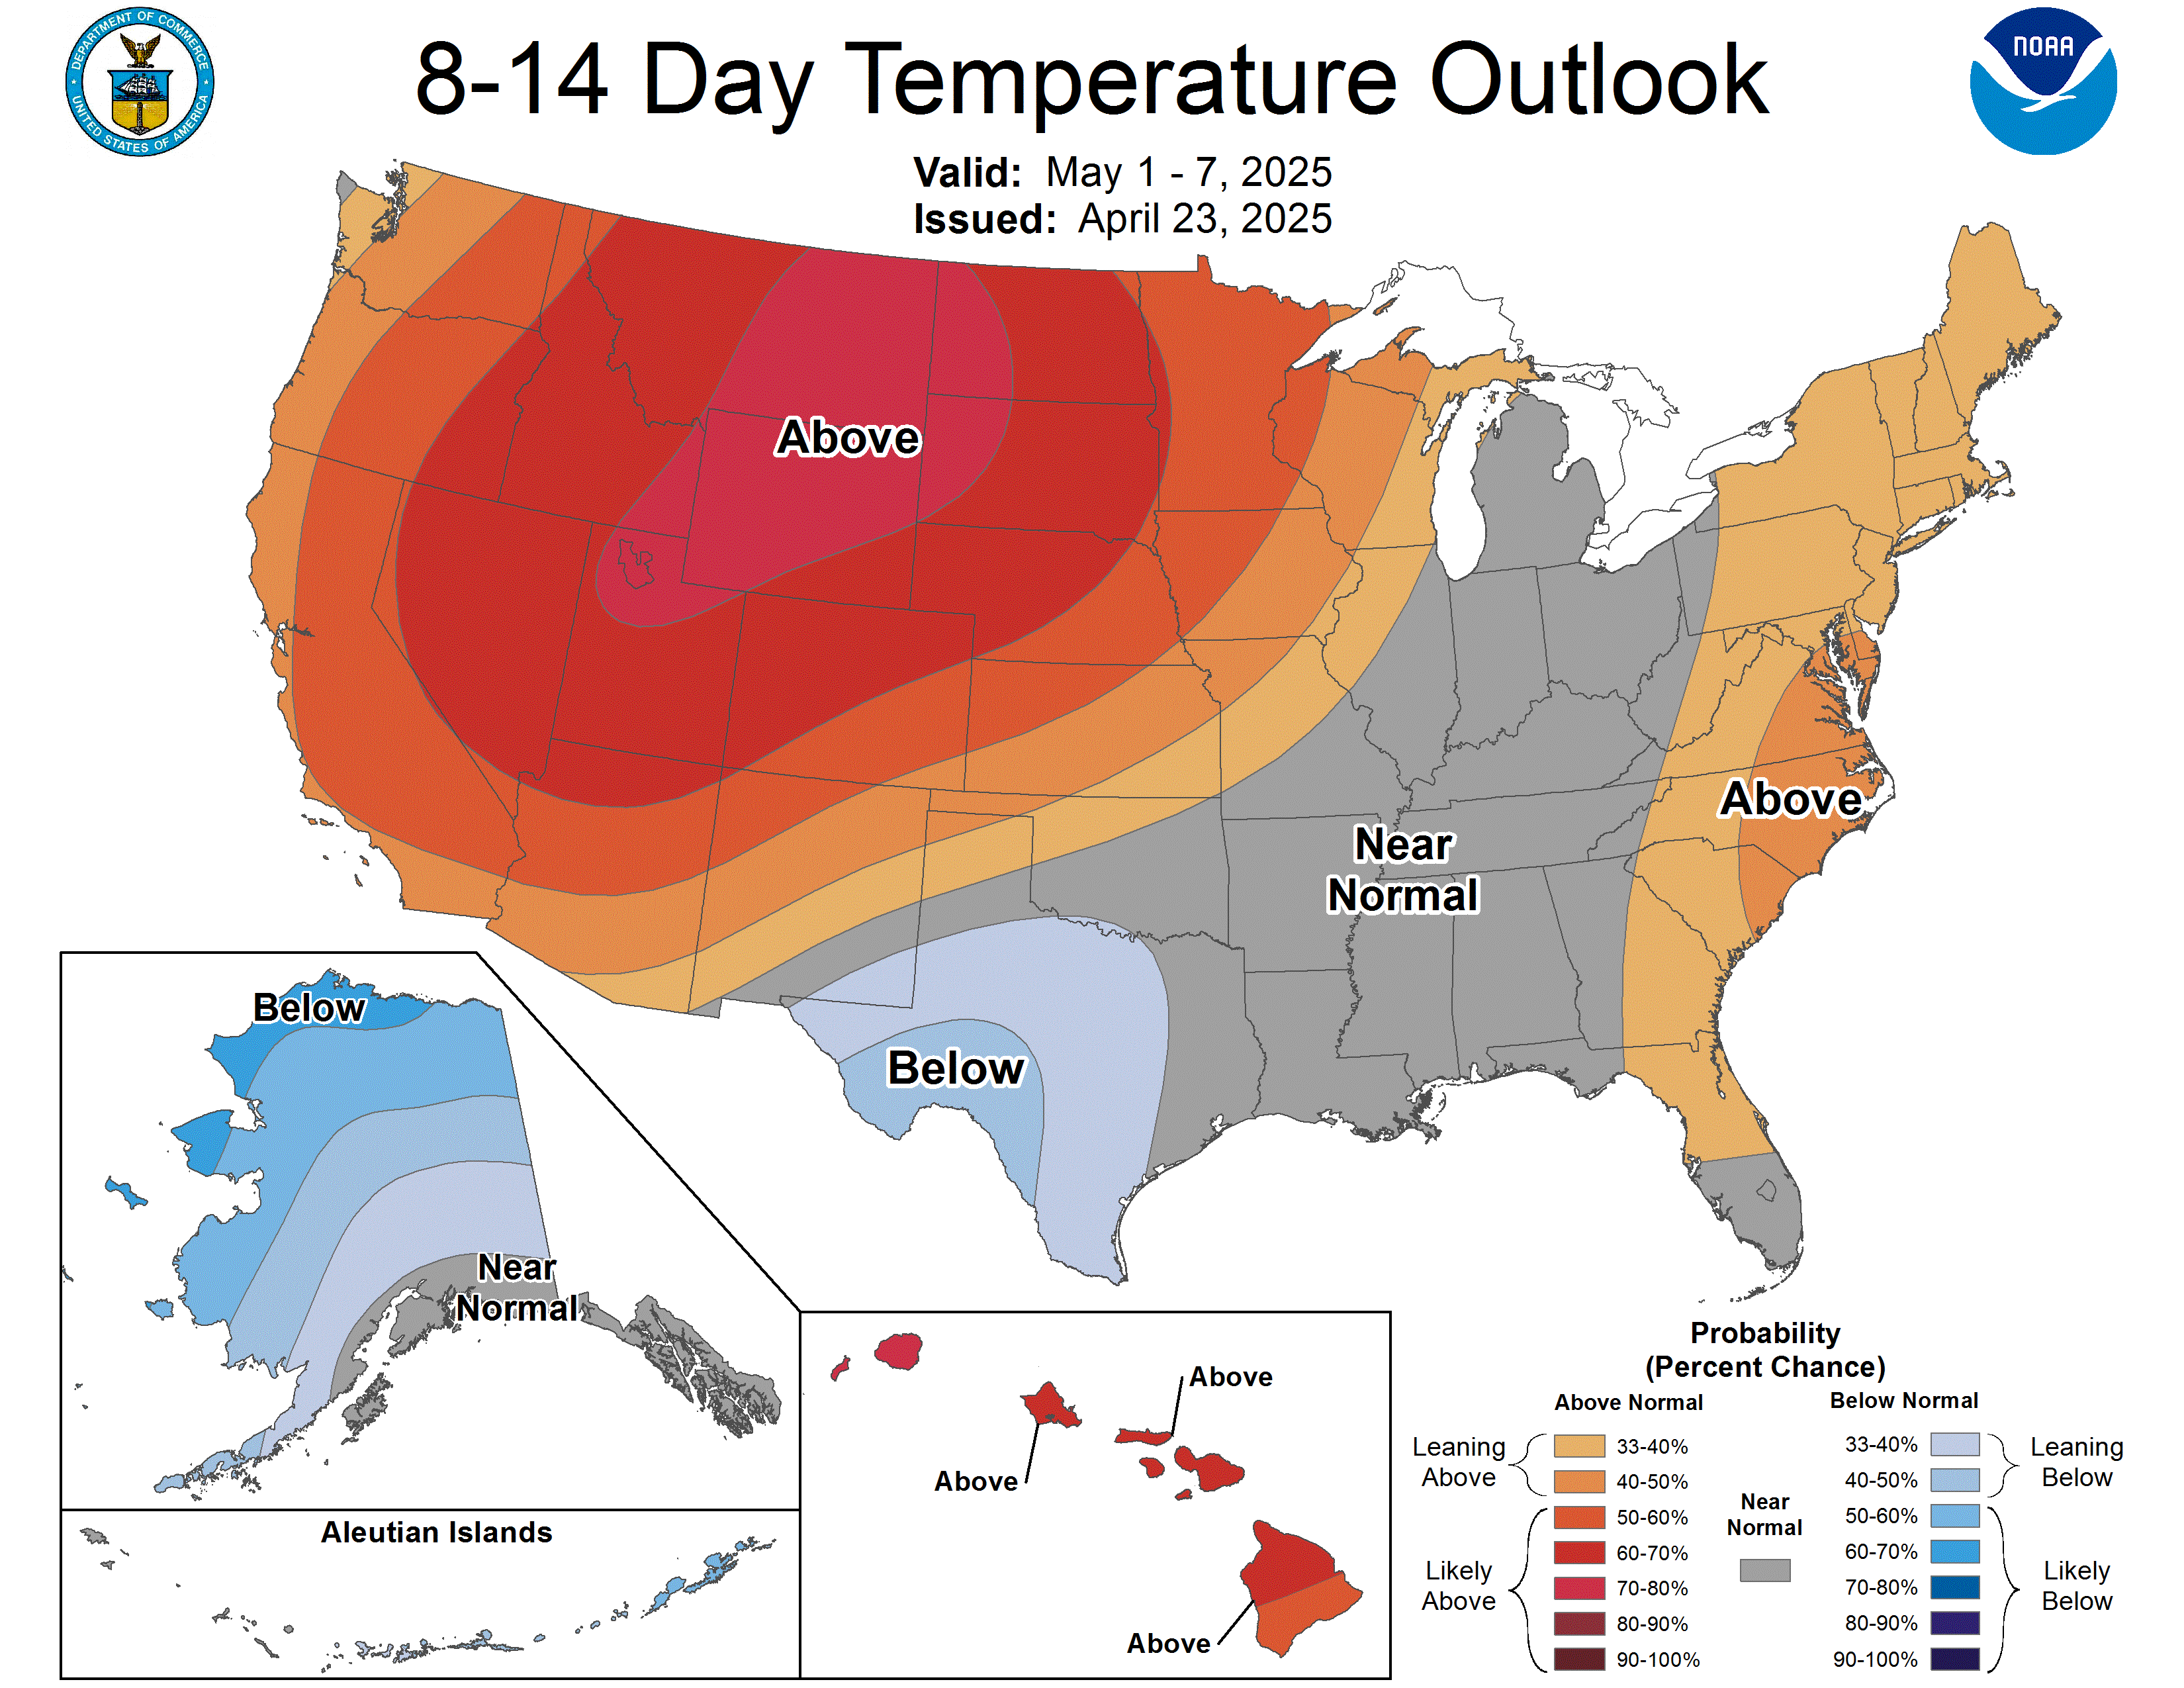
Above-normal temperatures remain indicated for much of the Lower 48 under
persistent ridging. The highest chances remain centered over southern
California and the Northern Plains (>60%), with 50-60% odds over much of the
Great Basin northeastward to the western Great Lakes. Lower odds for
above-normal temperatures are indicated over portions of the Southern Plains
due to lingering cloudiness from a stalled frontal boundary, while weak
troughing over eastern Canada maintains near-normal temperatures across much of
the northeastern CONUS into the Mid-Atlantic. Similar positioning of troughing
over the Gulf of Alaska maintains an east-west gradient, with below-normal
temperatures indicated along the western coast and above-normal temperatures
for Southeast Alaska. Above-normal temperatures are favored for Hawaii with
greater probabilities for the Big Island, consistent with the temperature
consolidation.
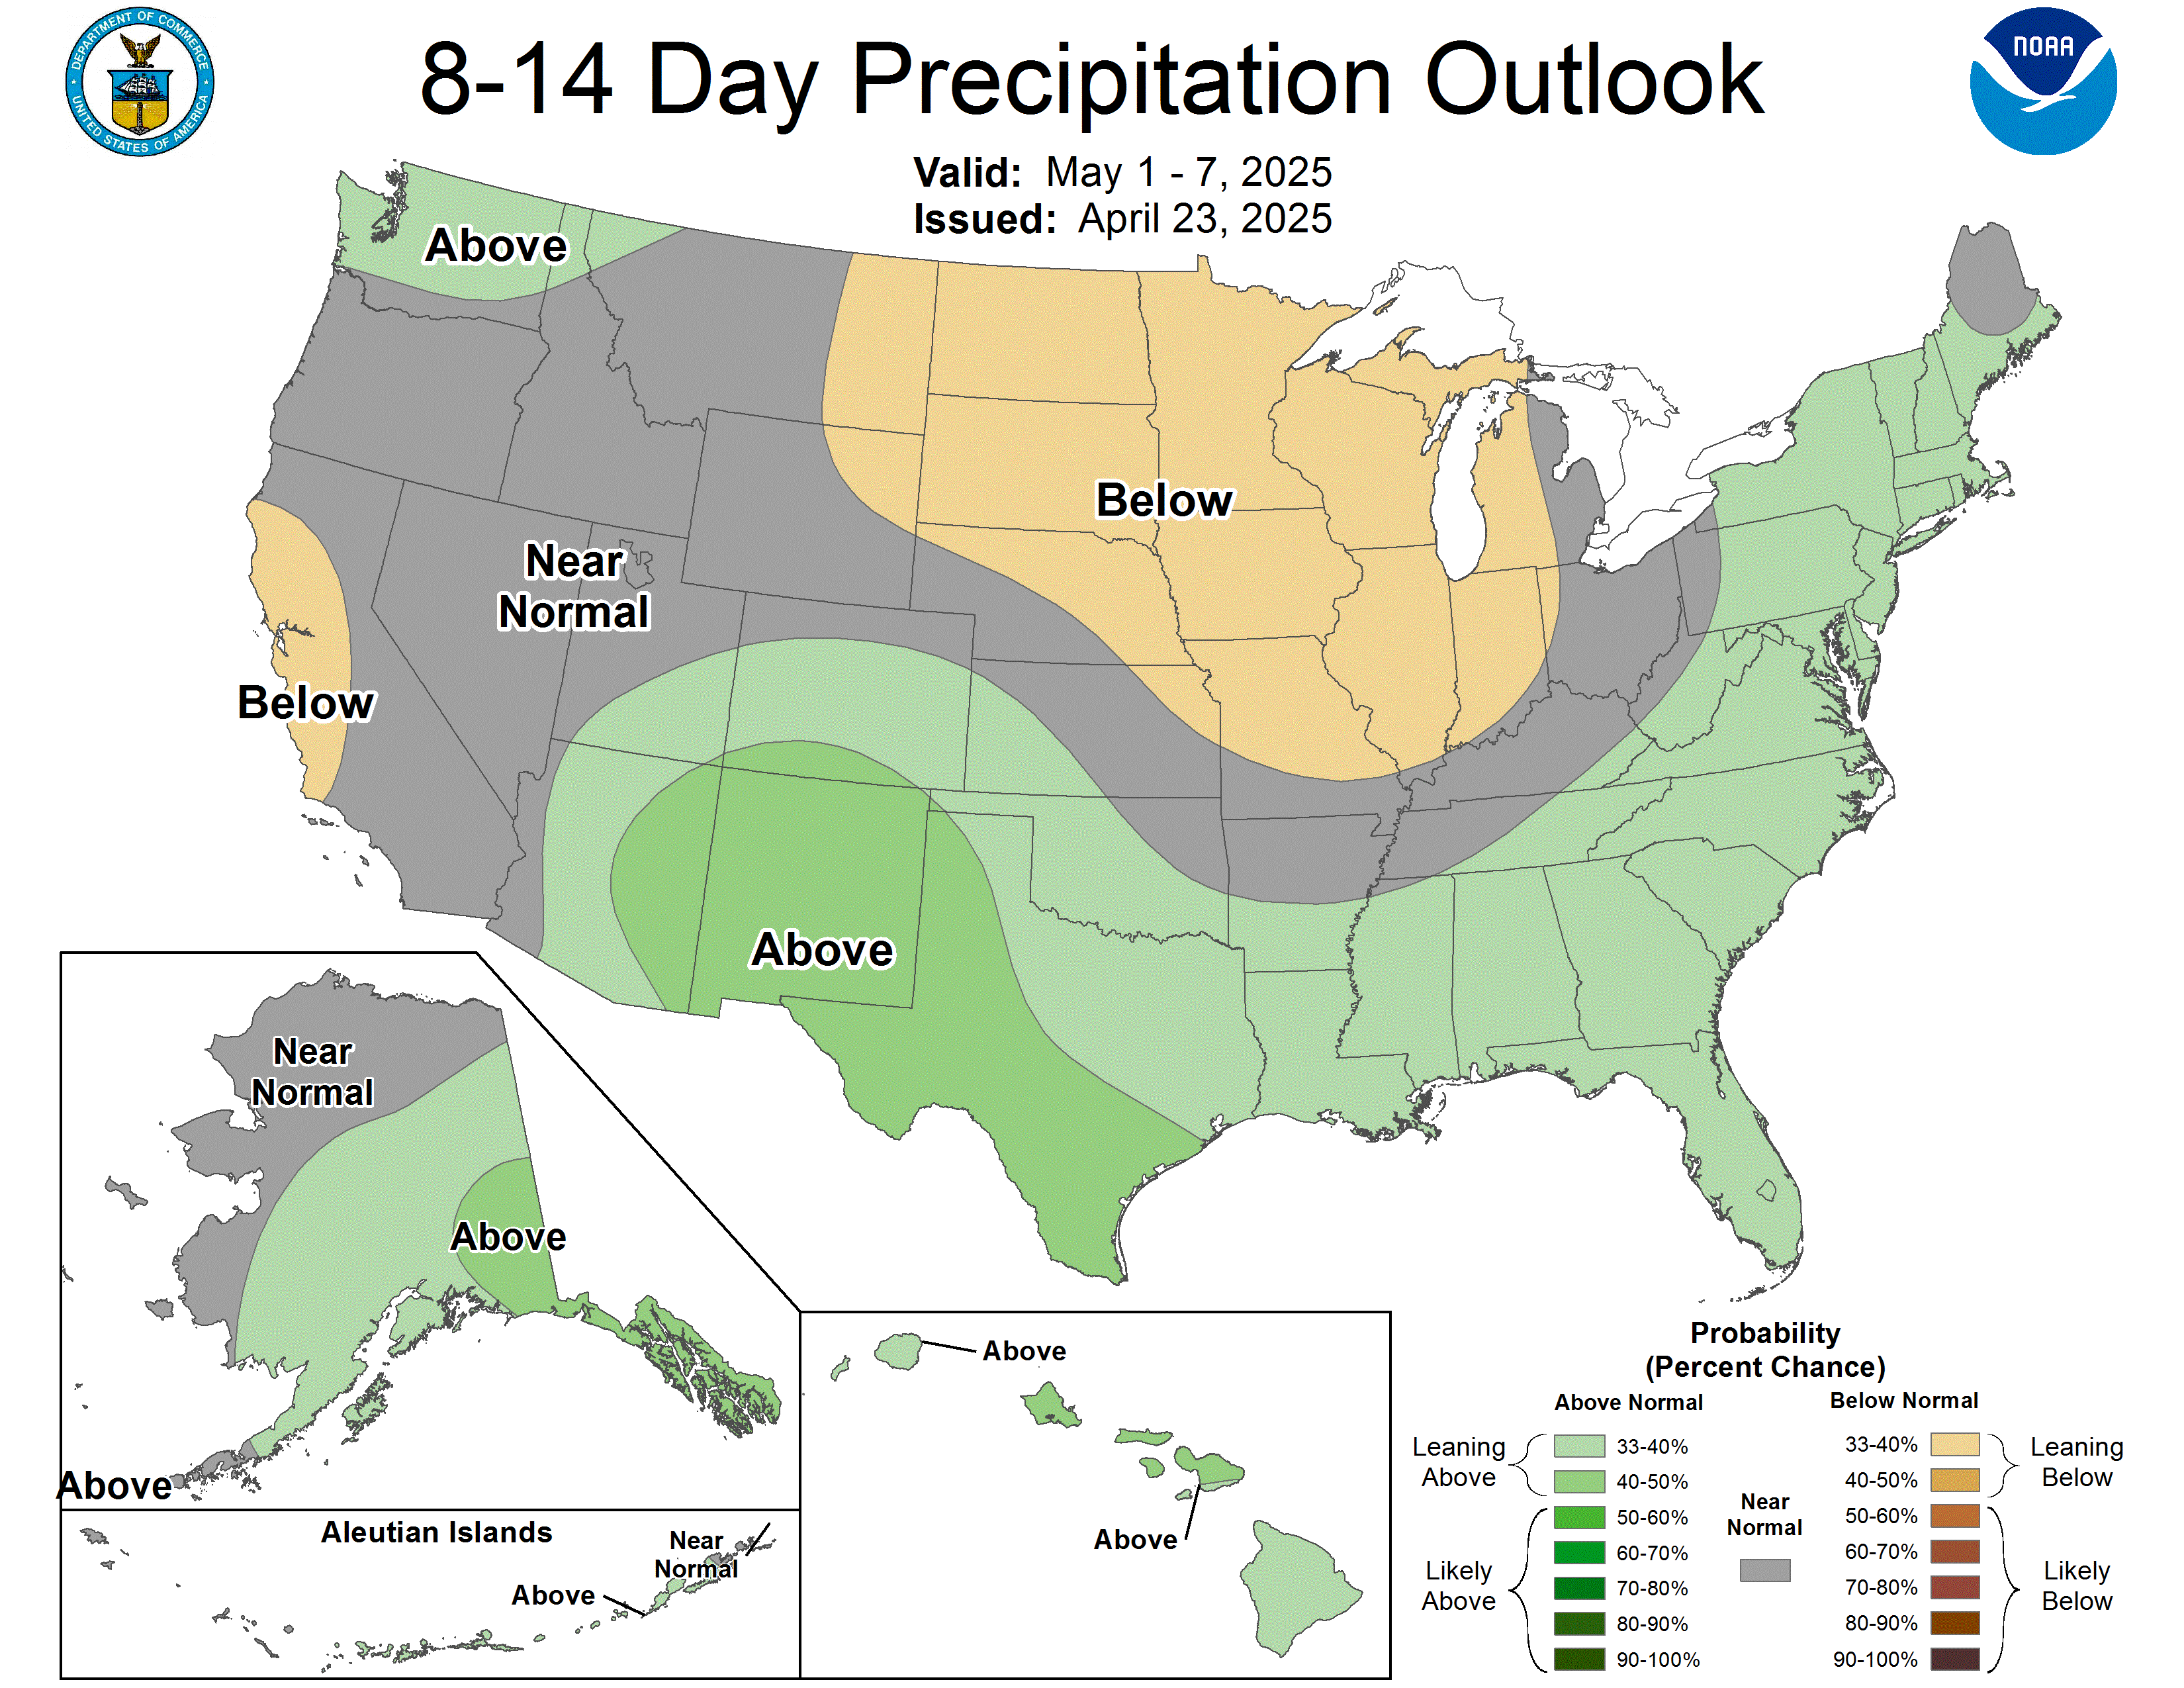
Persistent ridging over the Great Plains pushes most of the northern half of
the CONUS towards below-normal precipitation, with slightly enhanced odds
(40-50%) from northern California and western Nevada, as well as portions of
the Central Plains and theMiddle Mississippi, and western Ohio Valleys.
Above-normal precipitation is still favored over the Desert Southwest, along
the Lower Rio Grande Valley and Gulf Coast where a potential stalled frontal
boundary and increased moisture sourced from the tropical Eastern Pacific may
result in enhanced rain. With a weaker trough over the Gulf of Alaska the
potential for enhanced precipitation is more limited, but above-normal
precipitation remains favored along the southern coast and Southeast Alaska.
Above-normal precipitation is favored for Hawaii, consistent with the
calibrated ECMWF precipitation forecast.
The official 8-14 day 500-hPa height blend consists of: 33% of Today's 0z GFS
Ensemble Mean centered on Day 11, 34% of Today's 0z European Ensemble Mean
centered on Day 11, and 33% of Today's 0z Canadian Ensemble Mean centered on
Day 11
FORECAST CONFIDENCE FOR THE 8-14 DAY PERIOD: Above average, 4 out of 5, due to
good agreement between model forecasts of the mean large-scale mid-level height
pattern, offset by wide spread among precipitation forecast tools.
FORECASTER: Daniel Barandiaran
Notes:
The notation for the categorical forecast indicated on the maps is
the same as that in the tables: A-above N-near normal B-below
The temperature map shows regions with > 33% chance of being warmer
(orange, "A"), colder (blue, "B"), or close to (gray, "N") normal.
Labels on the shaded lines give the probability (> 33%) of the more
likely category (B or A). Probability of N is always < 40%.
The precipitation map shows regions with > 33% chance of being
wetter (green, "A"), drier (tan, "B"), or close to (gray, "N")
normal. Labels on the shaded lines give the probability (> 33%) of
the more likely category (B or A). Probability of N is always < 40%.
In the southwest and other climatologically dry regions - there will
be a greater than 33.3% chance of no precipitation and occasionally
even a normal (i.e. Median) value of zero - especially during the dry
seasons. In such cases a forecast of near normal is effectively a
forecast of little or no precipitation.
The climate prediction center uses 1991-2020 base period means as
reference in the climate outlooks.
The next set of long-lead monthly and seasonal outlooks will be released on
October 15.
Analogs to the 5 day mean observed pattern centered 3 days ago (D-3)
for the region from 20N to 70N latitude and 175E to 60W longitude
include the 5 day periods centered on the following dates:
20201007 - 19890929 - 20221010 - 19991020 - 20050922
Analogs to the 7 day mean observed pattern centered 4 days ago (D-4)
for the region from 20N to 70N latitude and 175E to 60W longitude
include the 7 day periods centered on the following dates:
20201006 - 19991019 - 19891001 - 20200919 - 20221010
6-10 DAY OUTLOOK TABLE
Outlook for Oct 16 - 20 2026
STATE TEMP PCPN STATE TEMP PCPN STATE TEMP PCPN
WASHINGTON A N OREGON A B NRN CALIF A B
SRN CALIF A N IDAHO A B NEVADA A B
W MONTANA A B E MONTANA A B WYOMING A B
UTAH A B ARIZONA A N COLORADO A B
NEW MEXICO A A N DAKOTA A B S DAKOTA A B
NEBRASKA A B KANSAS A B OKLAHOMA A B
N TEXAS N N S TEXAS N A W TEXAS N A
MINNESOTA A B IOWA A B MISSOURI A B
ARKANSAS A B LOUISIANA A A WISCONSIN A B
ILLINOIS A B MISSISSIPPI A N MICHIGAN A B
INDIANA A B OHIO N B KENTUCKY N B
TENNESSEE A B ALABAMA A N NEW YORK B N
VERMONT B N NEW HAMP B N MAINE B N
MASS B N CONN B N RHODE IS B N
PENN B N NEW JERSEY B N W VIRGINIA N N
MARYLAND B N DELAWARE B N VIRGINIA N N
N CAROLINA N N S CAROLINA N N GEORGIA A N
FL PNHDL A A FL PENIN A A AK N SLOPE N N
AK ALEUTIAN N N AK WESTERN B N AK INT BSN N N
AK S INT N N AK SO COAST N A AK PNHDL A A
8-14 DAY OUTLOOK TABLE
Outlook for Oct 18 - 24 2026
STATE TEMP PCPN STATE TEMP PCPN STATE TEMP PCPN
WASHINGTON A N OREGON A N NRN CALIF A B
SRN CALIF A N IDAHO A B NEVADA A B
W MONTANA A B E MONTANA A B WYOMING A B
UTAH A N ARIZONA A A COLORADO A B
NEW MEXICO A A N DAKOTA A B S DAKOTA A B
NEBRASKA A B KANSAS A B OKLAHOMA A N
N TEXAS A A S TEXAS A A W TEXAS A A
MINNESOTA A B IOWA A B MISSOURI A B
ARKANSAS A B LOUISIANA A A WISCONSIN A B
ILLINOIS A B MISSISSIPPI A N MICHIGAN A B
INDIANA A B OHIO A B KENTUCKY A B
TENNESSEE A B ALABAMA A N NEW YORK A B
VERMONT N B NEW HAMP N B MAINE N B
MASS N B CONN N B RHODE IS N B
PENN A B NEW JERSEY N B W VIRGINIA A B
MARYLAND N B DELAWARE N B VIRGINIA N B
N CAROLINA N N S CAROLINA A N GEORGIA A N
FL PNHDL A A FL PENIN A A AK N SLOPE N N
AK ALEUTIAN N A AK WESTERN B N AK INT BSN N N
AK S INT N A AK SO COAST N A AK PNHDL A A
LEGEND
TEMPS WITH RESPECT TO NORMAL PCPN WITH RESPECT TO MEDIAN
A - ABOVE N - NEAR NORMAL A - ABOVE N - NEAR MEDIAN
B - BELOW B - BELOW
THE FORECAST CLASSES REPRESENT AVERAGES FOR EACH STATE. NORMAL
VALUES - WHICH MAY VARY WIDELY ACROSS SOME STATES - ARE
AVAILABLE FROM YOUR LOCAL WEATHER SERVICE FORECAST OFFICE.
FOR ADDITIONAL INFORMATION SEE MESSAGE FXUS06 KWBC - ON AWIPS AS
PMDMRD.
$$
Issued by the Climate Prediction Center