Arctic Oscillation Index (AO)
Data Courtesy Climate Data Center


AO Index | AMOC Index | ENSO | EPO Index | MEIv2 Index | NAO Index | PDO Index | PNA Index | QBO Index | Teleconnection Monthly Summary
1950's | 1960's | 1970's | 1980's | 1990's | 2000's | 2010's | 2020's
ENSO and Snowfall Earth | 1960's | 1970's | 1980's | 1990's | 2000's | 2010's | 2020's
Arctic Oscillation Index (AO)
The Arctic Oscillation (AO) is a climate index of the state of the atmospheric circulation over the Arctic. It consists of a positive phase, featuring below average geopotential heights , which are also referred to as negative geopotential height anomalies , and a negative phase in which the opposite is true.
In the negative phase, the polar low pressure system (also known as the polar vortex) over the Arctic is weaker, which results in weaker upper level winds (the westerlies). The result of the weaker westerlies is that cold, Arctic air is able to push farther south into the U.S., while the storm track also remains farther south. The opposite is true when the AO is positive: the polar circulation is stronger which forces cold air and storms to remain farther north. The Arctic Oscillation often shares phase with the North Atlantic Oscillation (NAO), and its phases directly correlate with the phases of the NAO concerning implications on weather across the U.S.
Negative Arctic Oscillation

The degree to which Arctic air penetrates into middle latitudes is related to the AO index, which is defined by surface atmospheric pressure patterns. When the AO index is positive, surface pressure is low in the polar region. This helps the middle latitude jet stream to blow strongly and consistently from west to east, thus keeping cold Arctic air locked in the polar region. When the AO index is negative, there tends to be high pressure in the polar region, weaker zonal winds, and greater movement of frigid polar air into middle latitudes.
In the positive phase, higher pressure at mid-latitudes drives ocean storms farther north, and changes in the circulation pattern bring wetter weather to Alaska, Scotland and Scandinavia, as well as drier conditions to the western United States and the Mediterranean. In the positive phase, frigid winter air does not extend as far into the middle of North America as it would during the negative phase of the oscillation. This keeps much of the United States east of the Rocky Mountains warmer than normal, but leaves Greenland and Newfoundland colder than usual. Weather patterns in the negative phase are in general "opposite" to those of the positive phase.
Positive Arctic Oscillation

AO Pressure Patterns

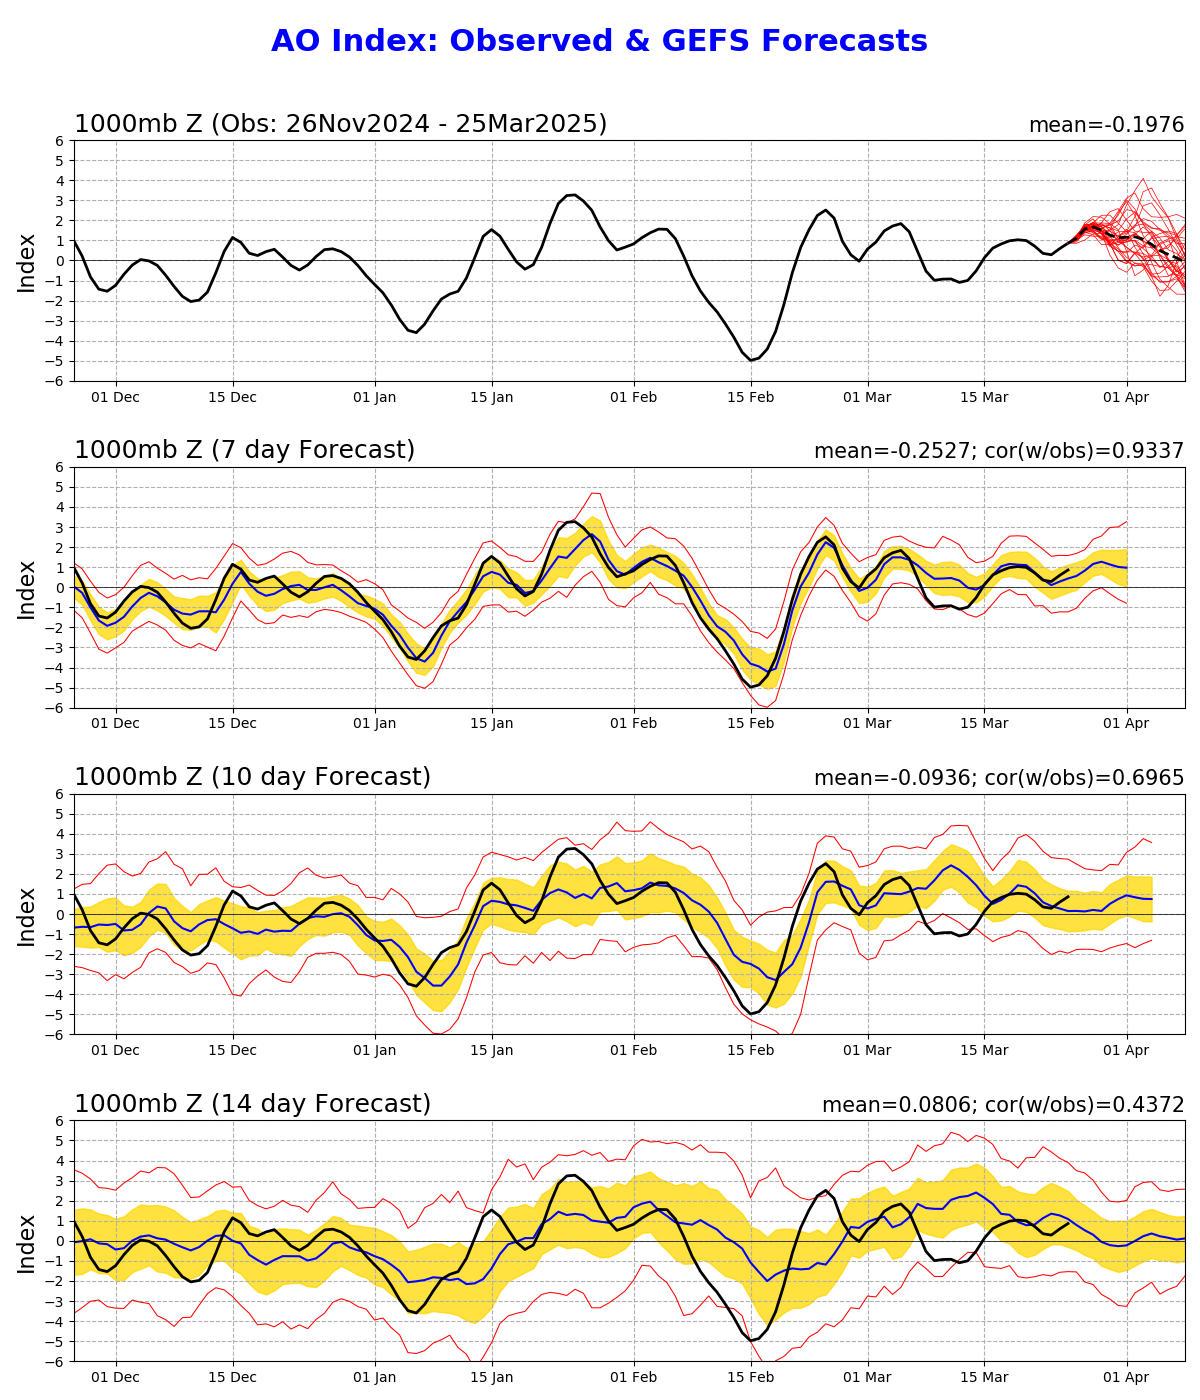
AO Observed and GEFS Ensemble Forecast
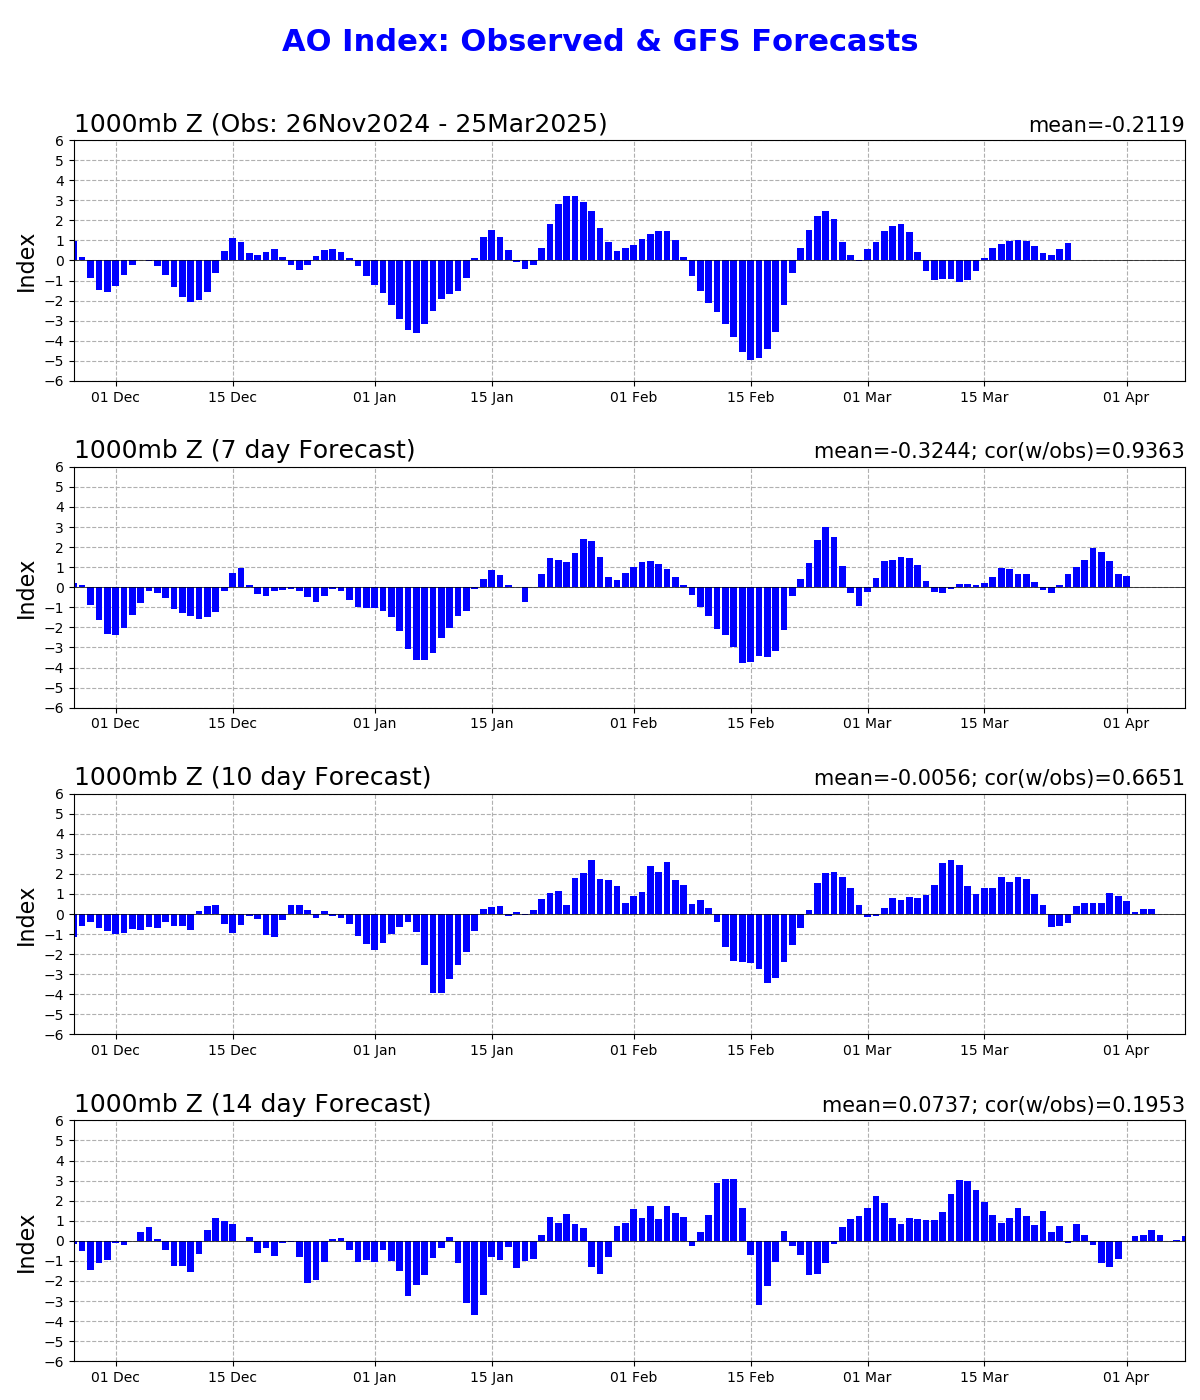
AO Observed and GFS Deterministic Forecast
Standardized 3-month running mean value of the AO Index

Standardized JFM Season Standardized AO Index - 1950-2023

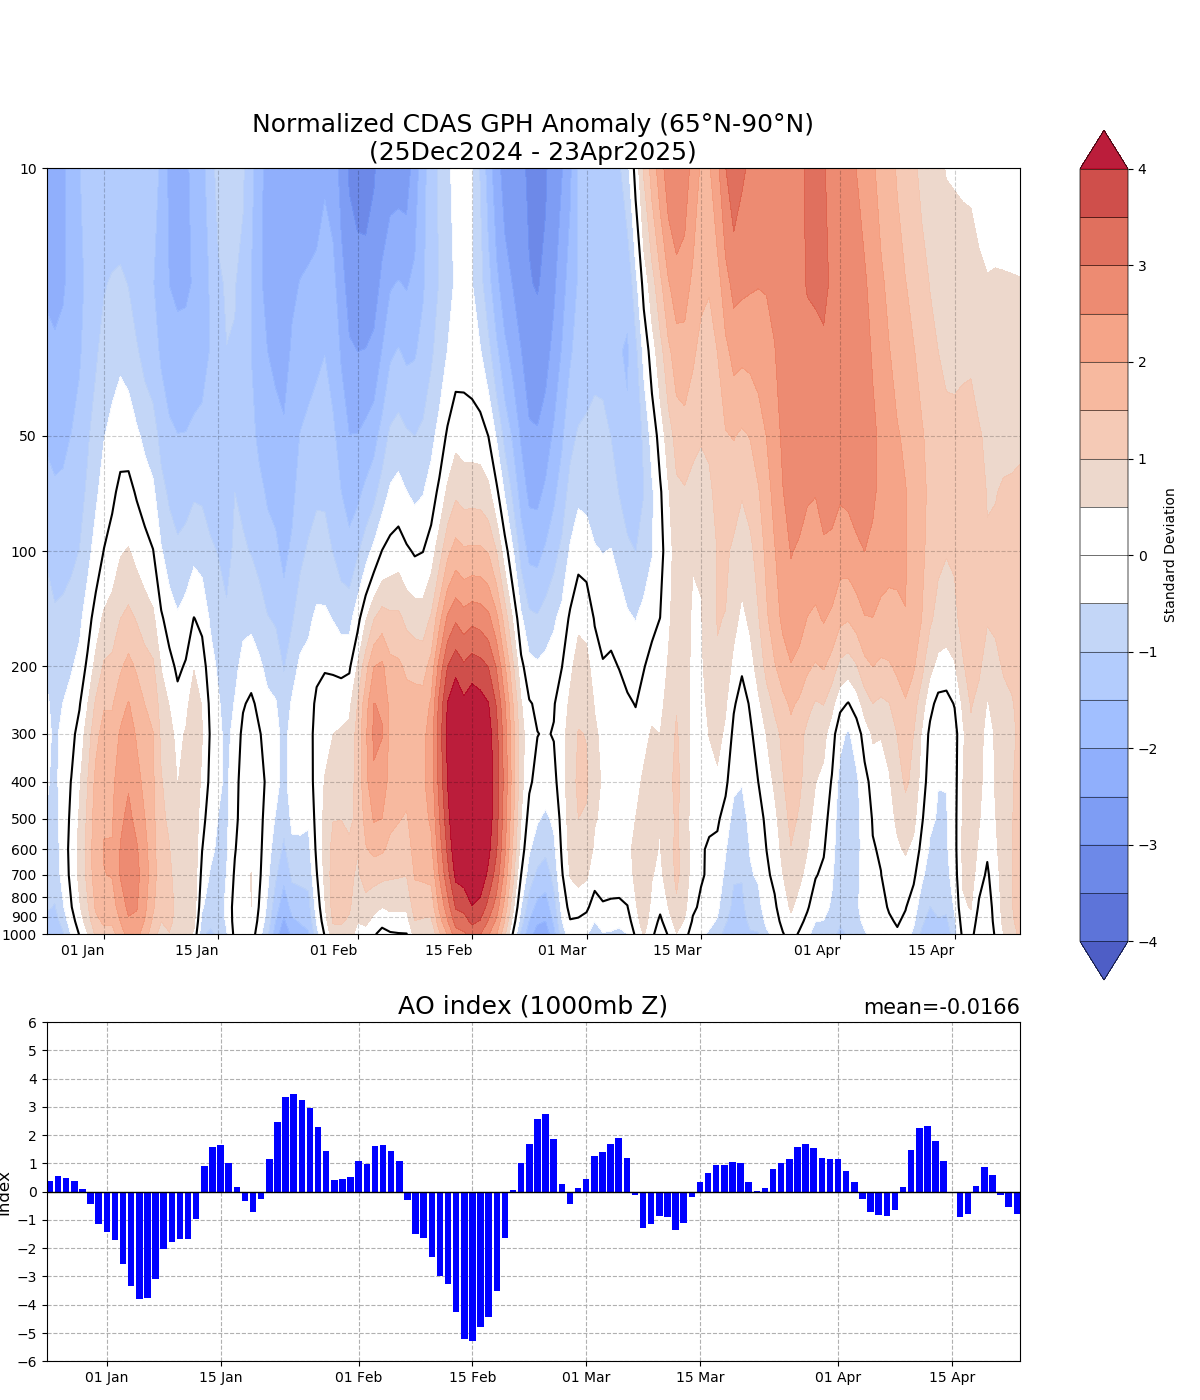
Vertical Cross Section and 120 Day Index Graph
AO Values by Year and Month
| Arctic Oscillation Index | Updated: | 9/26/2026 | |||||||||||
| Year | Jan | Feb | Mar | Apr | May | Jun | Jul | Aug | Sep | Oct | Nov | Dec | Avg |
| 1950 | -0.06 | 0.63 | -0.01 | 0.56 | 0.07 | 0.54 | -0.80 | -0.85 | 0.36 | -0.38 | -0.52 | -1.93 | -0.20 |
| 1951 | -0.09 | -0.40 | -1.93 | -0.78 | -0.86 | -0.92 | 0.09 | -0.38 | -0.82 | -0.21 | -0.07 | 1.99 | -0.36 |
| 1952 | 0.37 | -1.75 | -1.86 | 0.54 | -0.77 | -0.44 | 0.38 | -0.03 | -0.38 | -0.44 | -1.89 | -1.83 | -0.67 |
| 1953 | -1.04 | -0.25 | 1.07 | -1.26 | -0.56 | 0.02 | 0.33 | 0.09 | 0.66 | -0.19 | 0.35 | 0.58 | -0.02 |
| 1954 | -0.15 | -0.18 | 0.48 | 0.51 | -1.66 | -0.27 | 0.34 | -0.12 | 0.30 | 0.51 | -0.33 | 0.55 | 0.00 |
| 1955 | -1.16 | -1.54 | -1.57 | 0.19 | 0.24 | -0.27 | 0.33 | 0.76 | 0.36 | 0.10 | -1.34 | -0.44 | -0.36 |
| 1956 | -1.20 | -2.03 | 0.47 | -0.87 | 1.39 | 0.28 | -0.22 | -0.65 | -0.20 | 1.14 | -0.07 | 0.00 | -0.16 |
| 1957 | 2.06 | -1.51 | -2.01 | 0.24 | -0.97 | -0.76 | -0.65 | 0.10 | -0.96 | 0.90 | -1.38 | 0.83 | -0.34 |
| 1958 | -1.44 | -2.23 | -2.52 | -0.36 | -0.34 | -1.15 | -0.68 | -0.76 | -0.01 | 0.77 | -0.01 | -1.69 | -0.87 |
| 1959 | -2.01 | 2.54 | 1.43 | 0.12 | -0.34 | -0.03 | 0.11 | -0.75 | -0.28 | -0.25 | -1.41 | -0.04 | -0.08 |
| 1960 | -2.48 | -2.21 | -1.63 | -0.30 | -0.86 | 0.06 | -0.62 | -1.01 | -0.38 | -1.19 | -0.55 | -0.34 | -0.96 |
| 1961 | -1.51 | 0.62 | 0.34 | -0.24 | 0.16 | 0.84 | -0.11 | 0.01 | 0.82 | 0.20 | -0.01 | -1.67 | -0.05 |
| 1962 | 1.65 | -0.36 | -2.85 | 1.17 | 0.07 | 0.29 | -0.93 | 0.15 | -0.06 | -0.02 | -1.11 | -0.71 | -0.23 |
| 1963 | -3.31 | -1.72 | 0.72 | -0.35 | 0.77 | -0.59 | -0.30 | -0.63 | 0.08 | 1.07 | -0.42 | -1.18 | -0.49 |
| 1964 | 0.39 | -0.58 | -0.56 | 0.66 | 1.17 | 0.14 | 0.73 | -1.21 | -0.23 | 0.34 | -0.34 | -0.25 | 0.02 |
| 1965 | -1.05 | -2.08 | -0.91 | 0.57 | -0.15 | 0.04 | -0.51 | -0.26 | -0.70 | 0.39 | -1.34 | 0.16 | -0.49 |
| 1966 | -3.23 | -1.44 | -0.91 | -1.84 | 1.12 | 0.41 | 0.01 | -0.95 | 0.01 | -1.08 | 0.11 | -1.40 | -0.76 |
| 1967 | -0.58 | 1.18 | 1.97 | 1.70 | 0.13 | 0.65 | 0.26 | -0.29 | 0.13 | 1.30 | 0.33 | -0.35 | 0.54 |
| 1968 | -0.41 | -2.15 | 1.74 | 0.33 | -0.24 | 0.42 | -0.84 | -0.67 | -1.01 | -1.01 | -2.18 | -0.78 | -0.57 |
| 1969 | -2.97 | -3.11 | -1.58 | 0.44 | -0.72 | -0.35 | 0.41 | -0.78 | -0.08 | 0.10 | 0.33 | -1.86 | -0.85 |
| 1970 | -2.41 | -1.33 | -2.08 | 0.30 | 0.53 | 0.88 | 0.14 | -0.26 | 0.03 | 0.10 | 0.38 | -0.40 | -0.34 |
| 1971 | -0.16 | -0.92 | -1.09 | -0.58 | 0.68 | -0.67 | -0.58 | 0.82 | 0.15 | 1.19 | 0.42 | 0.82 | 0.01 |
| 1972 | 0.17 | -0.20 | -0.14 | 1.01 | 0.14 | -0.05 | -0.55 | -0.08 | -0.92 | 0.39 | -0.38 | 1.24 | 0.05 |
| 1973 | 1.23 | 0.79 | 0.54 | -1.13 | 0.07 | 0.53 | 0.27 | 0.31 | 0.11 | 0.34 | 0.00 | -0.18 | 0.24 |
| 1974 | 0.23 | -0.49 | -0.75 | 0.31 | -0.51 | -0.05 | 0.39 | -0.53 | -0.14 | -1.02 | -0.44 | 0.56 | -0.20 |
| 1975 | 1.60 | 0.19 | 0.15 | 0.41 | -0.61 | -0.32 | 0.35 | 0.13 | 1.28 | 0.14 | 0.62 | 1.29 | 0.43 |
| 1976 | 0.03 | 1.66 | 0.59 | 0.44 | 0.06 | 0.33 | -0.33 | 0.56 | -0.74 | -0.80 | -0.09 | -2.07 | -0.03 |
| 1977 | -3.77 | -2.01 | 0.34 | 1.33 | 0.10 | -0.23 | -0.49 | -1.41 | 0.59 | -0.01 | 0.61 | -0.24 | -0.43 |
| 1978 | -0.35 | -3.01 | 0.50 | -0.97 | 0.06 | 0.64 | -0.60 | -0.35 | -0.10 | 0.90 | 2.47 | -0.98 | -0.15 |
| 1979 | -2.23 | -0.70 | -0.81 | -1.16 | -0.25 | 0.93 | 0.04 | -0.68 | -0.05 | -1.24 | 0.48 | 1.30 | -0.37 |
| 1980 | -2.07 | -0.93 | -1.43 | -0.42 | -1.16 | 0.72 | -0.62 | -0.19 | 0.31 | -0.52 | -1.36 | -0.06 | -0.64 |
| 1981 | -0.12 | -0.33 | -1.65 | 0.43 | 0.18 | -0.44 | 0.56 | -0.24 | -1.04 | -1.17 | -0.19 | -1.22 | -0.43 |
| 1982 | -0.88 | 0.97 | 1.07 | 1.45 | -0.21 | -1.18 | 0.01 | 0.36 | 0.56 | -0.21 | 0.66 | 0.97 | 0.30 |
| 1983 | 1.36 | -1.81 | -0.57 | -0.74 | -0.44 | 0.31 | 0.13 | 1.10 | 0.17 | 1.37 | -0.69 | 0.19 | 0.03 |
| 1984 | 0.91 | -0.30 | -2.39 | -0.28 | 0.48 | 0.01 | 0.02 | 0.47 | -0.41 | -0.27 | -0.97 | 0.45 | -0.19 |
| 1985 | -2.81 | -1.44 | 0.55 | 0.65 | -0.43 | -0.35 | -0.39 | 0.00 | 0.11 | 1.04 | -1.22 | -1.95 | -0.52 |
| 1986 | -0.57 | -2.90 | 1.93 | 0.10 | 0.37 | 0.54 | -0.01 | -0.83 | -0.02 | 1.43 | 0.93 | 0.06 | 0.08 |
| 1987 | -1.15 | -1.47 | -1.75 | 0.39 | 0.33 | -0.71 | -0.47 | -0.84 | 0.29 | -0.08 | -0.54 | -0.53 | -0.54 |
| 1988 | 0.27 | -1.07 | -0.20 | -0.56 | -0.85 | 0.06 | -0.14 | 0.26 | 1.04 | 0.03 | -0.04 | 1.68 | 0.04 |
| 1989 | 3.11 | 3.28 | 1.53 | -0.25 | 0.89 | 0.35 | 0.87 | 0.55 | 0.70 | 0.99 | 0.03 | -0.64 | 0.95 |
| 1990 | 1.00 | 3.40 | 2.99 | 1.88 | 0.94 | 0.30 | -0.30 | -0.18 | -0.21 | 0.66 | 0.52 | 1.28 | 1.02 |
| 1991 | 0.72 | -0.88 | -0.53 | 0.53 | 0.49 | -0.12 | -0.19 | 0.80 | -0.11 | -0.25 | 0.29 | 1.61 | 0.20 |
| 1992 | 0.55 | 1.12 | 0.98 | -0.52 | 1.34 | -0.30 | 0.19 | 0.54 | -0.64 | -0.37 | 0.72 | 1.63 | 0.44 |
| 1993 | 3.50 | 0.18 | 0.76 | -0.44 | -1.61 | -0.52 | -0.51 | -0.39 | -0.36 | -0.57 | 1.00 | -0.10 | 0.08 |
| 1994 | -0.29 | -0.86 | 1.88 | 0.23 | -0.12 | 1.61 | 0.35 | 0.83 | -0.08 | 0.17 | 1.78 | 0.89 | 0.53 |
| 1995 | -0.15 | 1.43 | 0.39 | -0.96 | -0.89 | -0.11 | -0.22 | 0.54 | -0.55 | 0.08 | -0.72 | -2.13 | -0.27 |
| 1996 | -1.20 | 0.16 | -1.48 | -1.53 | -0.23 | 0.50 | 0.72 | 0.13 | -1.14 | 0.18 | 0.14 | -1.72 | -0.46 |
| 1997 | -0.46 | 1.89 | 1.09 | 0.32 | -0.96 | -0.82 | -0.43 | 0.12 | 0.20 | -0.70 | -0.66 | -0.07 | -0.04 |
| 1998 | -2.08 | -0.18 | -0.25 | -0.04 | 0.43 | -0.71 | -0.21 | 0.65 | -1.05 | 0.29 | -1.45 | 1.35 | -0.27 |
| 1999 | 0.11 | 0.48 | -1.49 | 0.28 | 0.23 | 0.71 | 0.00 | -0.67 | 0.06 | -0.01 | 0.61 | 1.04 | 0.11 |
| 2000 | 1.27 | 1.08 | -0.45 | -0.28 | 0.97 | 0.59 | -0.65 | 0.14 | 0.40 | 0.32 | -1.58 | -2.35 | -0.05 |
| 2001 | -0.96 | -0.62 | -1.69 | 0.91 | 0.45 | -0.02 | -0.03 | 0.52 | -0.71 | 0.71 | 0.82 | -1.32 | -0.16 |
| 2002 | 1.38 | 1.30 | 0.90 | 0.75 | 0.40 | 0.57 | 0.33 | -0.23 | -0.04 | -1.49 | -1.43 | -1.59 | 0.07 |
| 2003 | -0.47 | 0.13 | 0.93 | -0.18 | 1.02 | -0.10 | 0.08 | -0.28 | 0.47 | -0.67 | 0.64 | 0.27 | 0.15 |
| 2004 | -1.69 | -1.53 | 0.32 | -0.41 | -0.09 | -0.24 | -0.20 | -0.72 | 0.86 | -0.52 | 0.68 | 1.23 | -0.19 |
| 2005 | 0.36 | -1.27 | -1.35 | -0.05 | -0.76 | -0.38 | -0.03 | 0.03 | 0.80 | 0.03 | 0.23 | -2.10 | -0.38 |
| 2006 | -0.17 | -0.16 | -1.60 | 0.14 | 0.16 | 1.07 | 0.10 | -0.27 | 0.61 | -1.03 | 0.52 | 2.28 | 0.14 |
| 2007 | 2.03 | -1.31 | 1.18 | 0.54 | 0.89 | -0.56 | -0.40 | -0.03 | 0.18 | 0.38 | -0.52 | 0.82 | 0.27 |
| 2008 | 0.82 | 0.94 | 0.59 | -0.46 | -1.21 | -0.09 | -0.48 | -0.08 | -0.33 | 1.68 | 0.09 | 0.65 | 0.18 |
| 2009 | 0.80 | -0.67 | 0.12 | 0.97 | 1.19 | -1.35 | -1.36 | -0.05 | 0.88 | -1.54 | 0.46 | -3.41 | -0.33 |
| 2010 | -2.59 | -4.27 | -0.43 | -0.28 | -0.92 | -0.01 | 0.44 | -0.12 | -0.87 | -0.47 | -0.38 | -2.63 | -1.04 |
| 2011 | -1.68 | 1.58 | 1.42 | 2.28 | -0.04 | -0.86 | -0.47 | -1.06 | 0.67 | 0.80 | 1.46 | 2.22 | 0.53 |
| 2012 | -0.22 | -0.04 | 1.04 | -0.04 | 0.17 | -0.67 | 0.17 | 0.01 | 0.77 | -1.51 | -0.11 | -1.75 | -0.18 |
| 2013 | -0.61 | -1.01 | -3.19 | 0.32 | 0.49 | 0.55 | -0.01 | 0.15 | -0.46 | 0.26 | 2.03 | 1.48 | 0.00 |
| 2014 | -0.97 | 0.04 | 1.21 | 0.97 | 0.46 | -0.51 | -0.49 | -0.37 | 0.10 | -1.13 | -0.53 | 0.41 | -0.07 |
| 2015 | 1.09 | 1.04 | 1.84 | 1.22 | 0.76 | 0.43 | -1.11 | -0.69 | -0.17 | -0.25 | 1.95 | 1.44 | 0.63 |
| 2016 | -1.45 | -0.02 | 0.28 | -1.05 | -0.04 | 0.31 | 0.09 | 0.47 | 0.78 | -1.92 | -0.61 | 1.79 | -0.11 |
| 2017 | 0.94 | 0.34 | 1.37 | -0.09 | -0.73 | 0.40 | 0.63 | 0.15 | -0.49 | 0.69 | -0.08 | -0.06 | 0.26 |
| 2018 | -0.28 | 0.11 | -0.94 | 0.54 | 1.18 | 0.38 | 0.61 | 0.84 | 0.59 | 0.41 | -1.12 | 0.11 | 0.20 |
| 2019 | -0.71 | 1.15 | 2.12 | -0.26 | -1.23 | -0.60 | -0.89 | -0.72 | 0.31 | 0.08 | -1.19 | 0.41 | -0.13 |
| 2020 | 2.42 | 3.42 | 2.64 | 0.93 | -0.03 | -0.12 | -0.41 | -0.38 | 0.63 | -0.07 | 2.09 | -1.74 | 0.78 |
| 2021 | -2.48 | -1.19 | 2.11 | -0.20 | -0.16 | 0.84 | 0.63 | -0.22 | -0.25 | -0.14 | 0.10 | 0.20 | -0.06 |
| 2022 | 0.85 | 1.56 | 0.25 | -0.61 | 1.22 | -0.08 | 0.02 | -0.18 | -0.66 | 1.35 | 0.34 | -2.72 | 0.11 |
| 2023 | -0.67 | 1.60 | 0.28 | -0.97 | 1.13 | -0.29 | -0.15 | -0.60 | 0.32 | -0.41 | -0.04 | -0.22 | 0.00 |
| 2024 | -0.21 | 0.63 | -0.61 | 0.46 | -0.05 | 0.14 | 0.59 | 1.28 | -0.62 | -0.52 | -0.04 | -0.34 | 0.06 |
| 2025 | -0.07 | -0.86 | 0.56 | 0.27 | 0.90 | 1.13 | 0.50 | 0.04 | 0.05 | 0.06 | -0.47 | 0.27 | 0.20 |
| 2026 | -2.05 | -1.26 | 2.04 | 0.25 | 0.54 | 0.66 | 0.30 | -0.06 | 0.06 | ||||
| Avg | -0.38 | -0.28 | -0.04 | 0.09 | 0.03 | 0.00 | -0.10 | -0.12 | -0.01 | -0.01 | -0.07 | -0.18 | -0.09 |
| Max | 3.50 | 3.42 | 2.99 | 2.28 | 1.39 | 1.61 | 0.87 | 1.10 | 1.28 | 1.68 | 2.47 | 2.28 | 2.07 |
| Min | -3.77 | -4.27 | -3.19 | -1.84 | -1.66 | -1.35 | -1.36 | -1.41 | -1.14 | -1.92 | -2.18 | -3.41 | -2.29 |
| Month | Jan | Feb | Mar | Apr | May | Jun | Jul | Aug | Sep | Oct | Nov | Dec | Avg |
| https://www.cpc.ncep.noaa.gov/products/precip/CWlink/daily_ao_index/monthly.ao.index.b50.current.ascii | |||||||||||||
Never base important decisions on this or any weather information obtained from the Internet.
Always have a backup method of receiving weather information such as a battery powered weather radio.
Copyright © 2026 DaculaWeather.com
